

Mathematics, 03.12.2021 05:10, haydenbq
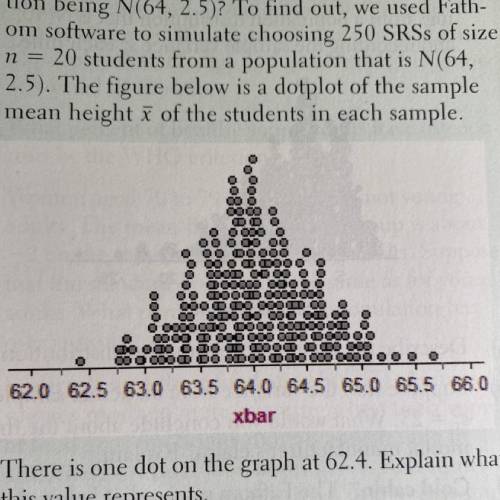
According to the National Center for Health Statistics, the distribution of heights for 16-year-old females is modeled well by a Normal density curve with mean y = 64 inches and standard deviation o = 2.5 inches. To see if this distribution applies at their high school, an AP Statistics class takes an SRS of 20 of the 300 16-year-old females at the school and measures their heights. What values of the sample mean would be consistent with the population distribution being N(64, 2.5)? To find out, we used Fathom software to simulate choosing 250 SRSs of size n=20 students from a population that is N(64,2.5). The figure below is a dotplot of the sample mean height of the students in each sample.

Answers: 3


Other questions on the subject: Mathematics
Mathematics, 21.06.2019 19:00, dfrtgyuhijfghj4794
Since opening night, attendance at play a has increased steadily, while attendance at play b first rose and then fell. equations modeling the daily attendance y at each play are shown below, where x is the number of days since opening night. on what day(s) was the attendance the same at both plays? what was the attendance? play a: y = 8x + 191 play b: y = -x^2 + 26x + 126 a. the attendance was never the same at both plays. b. the attendance was the same on day 5. the attendance was 231 at both plays on that day. c. the attendance was the same on day 13. the attendance was 295 at both plays on that day. d. the attendance was the same on days 5 and 13. the attendance at both plays on those days was 231 and 295 respectively.
Answers: 1
Do you know the correct answer?
According to the National Center for Health Statistics, the distribution of heights for 16-year-old...
Questions in other subjects:

Mathematics, 28.01.2021 19:00

English, 28.01.2021 19:00
Mathematics, 28.01.2021 19:00


