


Use the graph to determine which statement describes f(x).
AY
5
y = f(x)
5
...

Mathematics, 02.12.2021 18:00, triddi666
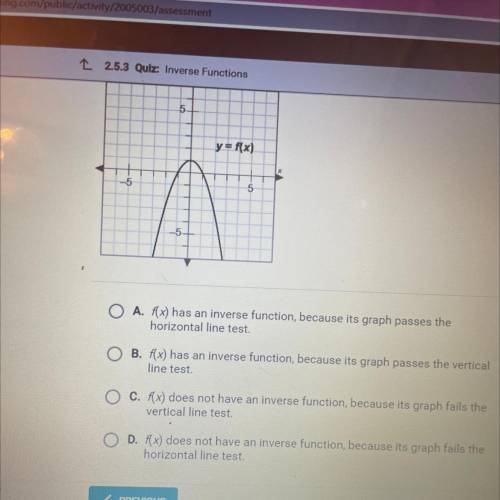
Use the graph to determine which statement describes f(x).
AY
5
y = f(x)
5
5
5
A. f(x) has an inverse function, because its graph passes the
horizontal line test.
B. f(x) has an inverse function, because its graph passes the vertical
line test.
c. f(x) does not have an inverse function, because its graph fails the
vertical line test.

Answers: 2
Other questions on the subject: Mathematics
Mathematics, 21.06.2019 19:30, 22emilyl530
Bobby bought 1.12 pounds of turkey at a cost of 2.50 per pound. carla bought 1.4 pounds of turkey at a cost of 2.20 per pound. who spent more and by much?
Answers: 2
Mathematics, 21.06.2019 21:30, shelbysargent11
Complete each statement from the information given and the triangle criterion you used. if the triangles cannot be shown to be congruent, leave the box for the second triangle blank and choose for reason “cannot be determined.” carbon - regular hexagon. ∆can ≅ ∆ by
Answers: 1
Mathematics, 21.06.2019 23:00, lejeanjamespete1
Graph the system of equations. {6x−4y=−244x−8y=−32 use the line tool to graph the lines.
Answers: 1
Mathematics, 21.06.2019 23:30, claytonhopkins
In a study of the relationship between socio-economic class and unethical behavior, 129 university of california undergraduates at berkeley were asked to identify themselves as having low or high social-class by comparing themselves to others with the most (least) money, most (least) education, and most (least) respected jobs. they were also presented with a jar of individually wrapped candies and informed that the candies were for children in a nearby laboratory, but that they could take some if they wanted. after completing some unrelated tasks, participants reported the number of candies they had taken. it was found that those who were identiď¬ed as upper-class took more candy than others. in this study, identify: (a) the cases, (b) the variables and their types, (c) the main research question, (d) identify the population of interest and the sample in this study, and (e) comment on whether or not the results of the study can be generalized to the population, and if the ď¬ndings of the study can be used to establish causal relationships.
Answers: 2
Do you know the correct answer?
Questions in other subjects:

Biology, 19.03.2021 02:50
Mathematics, 19.03.2021 02:50
Mathematics, 19.03.2021 02:50
Mathematics, 19.03.2021 02:50


