

Mathematics, 02.12.2021 16:50, arisworlld
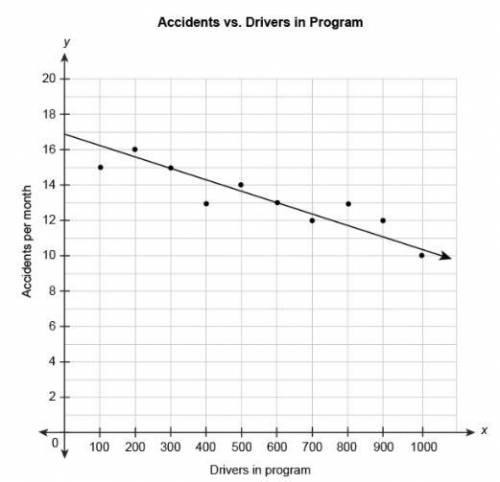
The scatter plot shows the relationship between the number of car accidents in a month and the number of drivers attending a program on distracted driving. The equation represents the linear model for this data.
y=−0.0067x+17
What does the number 17 in the equation mean in this context?
For every 100 drivers in the program, there are 17 accidents per month.
There were 17 accidents per month when there were no drivers in the program.
There were no accidents per month when there were 17 drivers in the program.
There were 17 drivers in the program when it started.
The number of accidents decreases by 17 for every 100 drivers in the program.

Answers: 2


Other questions on the subject: Mathematics
Mathematics, 21.06.2019 13:40, HomeWorkForLife
The pressure exerted on the walls of a container by a gas enclosed within it is directly proportional to the temperature of the gas. if the pressure is 6 pounds per square inch when the temperature is find the pressure exerted when the temperature of the gas is 380 degrees f show work for the
Answers: 2
Mathematics, 21.06.2019 21:00, kharmaculpepper
Joanie watched 1 out of three of a movie in the morning
Answers: 1
Mathematics, 21.06.2019 22:30, mackenziepaige6525
The median for the given set of six ordered data values is 29.5 9 12 25 __ 41 48 what is the missing value?
Answers: 1
Do you know the correct answer?
The scatter plot shows the relationship between the number of car accidents in a month and the numbe...
Questions in other subjects:


Mathematics, 18.10.2019 00:10


