

Mathematics, 13.11.2021 06:00, angelasan16
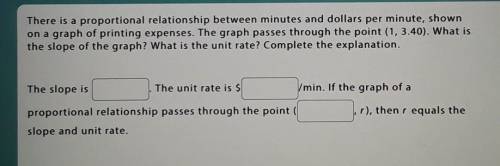
There is a proportional relationship between minutes and dollars per minute, shown on a graph of printing expenses. The graph passes through the point (1, 3.40). What is the slope of the graph? What is the unit rate? Complete the explanation.

Answers: 1


Other questions on the subject: Mathematics
Mathematics, 21.06.2019 19:00, Goldenstate32
Gh bisects fgi. find the measure of hgi •15° •21° •10° •8°
Answers: 2
Mathematics, 21.06.2019 20:00, brittanybyers122
Which type of graph would allow us to compare the median number of teeth for mammals and reptiles easily
Answers: 2
Mathematics, 22.06.2019 00:00, isabellecannuli
Margaret is purchasing a house for $210,000 with a 15 year fixed rate mortgage at 4.75% interest she has made a 5% down payment the house is valued at 205,000 and the local tax rate is 3.5% homeowners insurance 600 per year what are her total monthly payment
Answers: 1
Do you know the correct answer?
There is a proportional relationship between minutes and dollars per minute, shown on a graph of pri...
Questions in other subjects:


Biology, 30.10.2021 02:10
Chemistry, 30.10.2021 02:10


