

Mathematics, 26.10.2021 14:30, mohayon2020
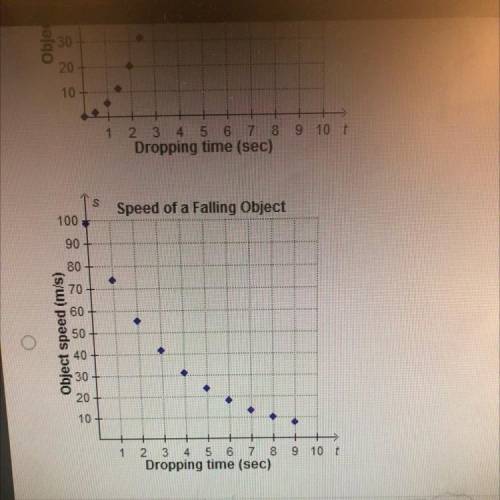
The speed of a falling object increases at a constant rate as time increases since the object was dropped Which
graph could represent the relationship between t time in seconds and s, speed in meters per second?
Speed of a Falling Object
100
90
80
70
60
Object speed (m/s)
20
10
9 10
8
Dropping time (sec)
.
Speed of a Falling Object
100
90
Mark this and return
NEX

Answers: 2


Other questions on the subject: Mathematics
Mathematics, 21.06.2019 22:00, hannahpalmario
The customer price index(cpi), which measures the cost of a typical package of customer goods, was 208.8 in 2011 and 244.1 in 2016.let x=11 corresponding to the year 2011 an estimate to cpi into 2013 and 2014. assume that the data can be modeled by a straight line and the trend to continue idenfinitely. use data points to find such a line and then estimate the requested quantities
Answers: 1
Do you know the correct answer?
The speed of a falling object increases at a constant rate as time increases since the object was dr...
Questions in other subjects:

Biology, 28.03.2021 17:40

Business, 28.03.2021 17:40


Computers and Technology, 28.03.2021 17:40


Geography, 28.03.2021 17:40
Mathematics, 28.03.2021 17:40
English, 28.03.2021 17:40


