

Mathematics, 20.10.2021 09:20, SketchWasTaken
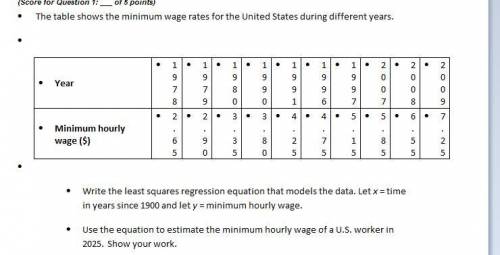
The table shows the minimum wage rates for the United States during different years.
Year 1978 1979 1980 1990 1991 1996 1997 2007 2008 2009
Minimum hourly wage 2.65 2.90 3.35 3.80 4.25 4.75 5.15 5.85 6.55 7.25
(a) Write the least squares regression equation that models the data. Let x = time in years since 1900 and let y = minimum hourly wage.
(b) Use the equation to estimate the minimum hourly wage of a U. S. worker in 2025. Show your work.
PLS ANSWER CORRECTLY WITH AN EXPLANATION

Answers: 2


Other questions on the subject: Mathematics
Mathematics, 21.06.2019 14:00, lashayreed02
Tracy solved the following problem. which of the statements is true? 9 ÷ 3 + 6 × 2 3 + 6 × 2 9 × 2 18 her answer is correct. her answer is incorrect. she should have multiplied before dividing. her answer is incorrect. she should have multiplied before adding. her answer is incorrect. she should have added before dividing.
Answers: 1
Mathematics, 21.06.2019 14:50, hiihihihij
Do 12/14 and 8/10 have the same value? explain your answer.
Answers: 1
Mathematics, 21.06.2019 22:30, gunnatvinson
If a line is defined by the equation y = 5x + 2, what is the slope?
Answers: 2
Mathematics, 22.06.2019 00:20, Jaymiegrimes22
Traffic on saturday, it took ms. torres 24 minutes to drive 20 miles from her home to her office. during friday's rush hour, it took 75 minutes to drive the same distance. a. what was ms. torres's average speed in miles per hour on saturday? b. what was her average speed in miles per hour on friday?
Answers: 1
Do you know the correct answer?
The table shows the minimum wage rates for the United States during different years.
Year 1978 197...
Questions in other subjects:


Business, 23.06.2019 17:00

History, 23.06.2019 17:00


