

Mathematics, 17.10.2021 05:30, tavidallaz5988
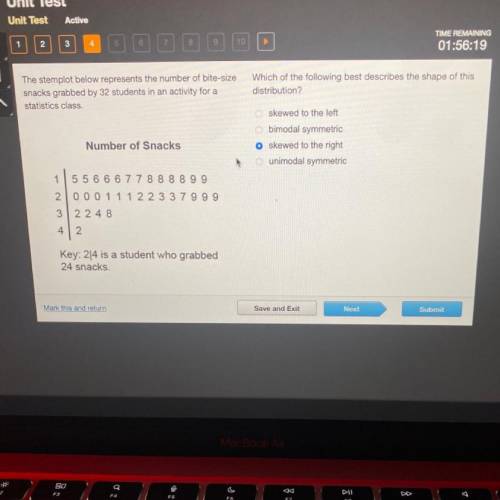
HELP!The stemplot below represents the number of bite-size
snacks grabbed by 32 students in an activity for a
statistics class.
Which of the following best describes the shape of this
distribution?
skewed to the left
Obimodal symmetric
skewed to the right
O unimodal symmetric
Number of Snacks
1 5 5 6 6 6 7 7 8 8 8 8 9 9
2000 1 1 1 2 2 3 3 7999
3 2248
4
2
Key: 24 is a student who grabbed
24 snacks.

Answers: 3


Other questions on the subject: Mathematics
Mathematics, 21.06.2019 16:00, asdf334asdf334
Josephine has a great garden with and area of 2x2 + x - 6 square feet
Answers: 2
Mathematics, 21.06.2019 20:30, kingdesto3481
The function v(r)=4/3pir^3 can be used to find the volume of air inside a basketball given its radius. what does v(r) represent
Answers: 1
Do you know the correct answer?
HELP!The stemplot below represents the number of bite-size
snacks grabbed by 32 students in an act...
Questions in other subjects:
Mathematics, 20.10.2020 02:01


Physics, 20.10.2020 02:01

History, 20.10.2020 02:01
Mathematics, 20.10.2020 02:01
Mathematics, 20.10.2020 02:01


