

Mathematics, 03.10.2021 09:50, lehbug01
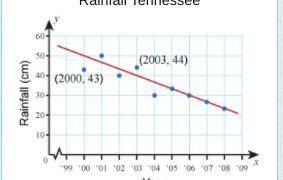
The scatter plot shows a correlation between the years and the rainfall in centimeters in Tennessee.
The line of regression models that correlation.
Enter a number to complete each statement.
In 2000, the actual rainfall was
? centimeters below what the model predicts.
In 2003, the actual rainfall was
? centimeters above what the model predicts.

Answers: 3


Other questions on the subject: Mathematics
Mathematics, 21.06.2019 16:20, PONBallfordM89
Abby is preparing fruit punch for her party. she starts with a bowl filled with liquid that has 1/2 fruit juice and 1/2 sprite, but she decides it's too fruity. so she pours out 1/4 of the liquid, and then fills the bowl up again with sprite. what fraction of the punch is now sprite?
Answers: 1
Mathematics, 21.06.2019 18:30, miayadeliss6910
How do you determine whether a relationship represented as as graph is linear or nonlinear
Answers: 1
Mathematics, 21.06.2019 22:30, lilmaddy8856
Which expressions equal 9 when x=4 and y=1/3 a. x2+6y b. 2x + 3y c. y2-21x d. 5 (x/2) -3y e. 3x-9y
Answers: 2
Do you know the correct answer?
The scatter plot shows a correlation between the years and the rainfall in centimeters in Tennessee....
Questions in other subjects:
Mathematics, 08.12.2020 18:50
Mathematics, 08.12.2020 18:50
Mathematics, 08.12.2020 18:50

History, 08.12.2020 18:50

Mathematics, 08.12.2020 18:50
Mathematics, 08.12.2020 18:50


Chemistry, 08.12.2020 18:50


