

Mathematics, 02.10.2021 04:20, kris22elizondop9v1bb
100 points
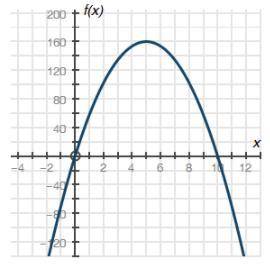
The graph below shows a company's profit f(x), in dollars, depending on the price of pencils x, in dollars, sold by the company:
Graph of quadratic function f of x having x intercepts at ordered pairs negative 0, 0 and 10, 0. The vertex is at 5, 160.
(Picture attached)
Part A: What do the x-intercepts and maximum value of the graph represent? What are the intervals where the function is increasing and decreasing, and what do they represent about the sale and profit?
Part B: What is an approximate average rate of change of the graph from x = 2 to x = 5, and what does this rate represent?
Part C: Describe the constraints of the domain.

Answers: 1


Other questions on the subject: Mathematics
Mathematics, 22.06.2019 01:50, Aidanme25
If its non of them tell me..valerie took a day-trip. she drove from her house for a while and took a coffee break. after her coffee break, she continued driving. after 2 hours of driving after her coffee break, her distance from her house was 210 miles. her average speed during the whole trip was 60 miles per hour. valerie created the equation y−210=60(x−2) to represent this situation, where xx represents the time in hours from her coffee break and yy represents the distance in miles from her house. which graph correctly represents valerie's distance from her house after her coffee break?
Answers: 1
Do you know the correct answer?
100 points
The graph below shows a company's profit f(x), in dollars, depending on the price of pe...
Questions in other subjects:
Mathematics, 25.09.2019 02:40

Social Studies, 25.09.2019 02:40
Mathematics, 25.09.2019 02:40
Social Studies, 25.09.2019 02:50

Geography, 25.09.2019 02:50

Health, 25.09.2019 02:50

English, 25.09.2019 02:50


