

Mathematics, 30.09.2021 23:30, AikawaAisyah2438
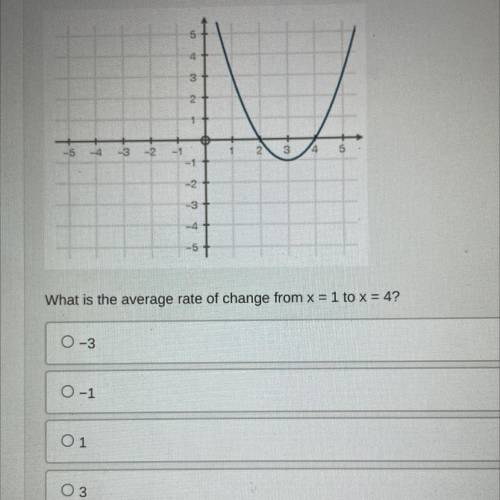
Use the graph below to answer the following question:
what is the average rate of change from X=1 to X=4
A -3
B -1
C 1
D 3

Answers: 2


Other questions on the subject: Mathematics
Mathematics, 21.06.2019 23:00, Baby010391
Which radical expression is a rational number? a. √ 360 b. √ 644 c. √ 225 d. √ 122
Answers: 1
Mathematics, 21.06.2019 23:10, krystalhurst97
What is the distance between the points (2, 5) and (5,9)?
Answers: 1
Mathematics, 21.06.2019 23:30, alexandramendez0616
Hich equation can pair with x + 2y = 5 to create an inconsistent system? 2x + 4y = 3 5x + 2y = 3 6x + 12y = 30 3x + 4y = 8
Answers: 3
Mathematics, 22.06.2019 02:30, sassycutie523
The upcoming championship high school football game is a big deal in your little town. the problem is, it is being played in the next biggest town, which is two hours away! to get as many people as you can to attend the game, you decide to come up with a ride-sharing app, but you want to be sure it will be used before you put all the time in to creating it. you determine that if more than three students share a ride, on average, you will create the app. you conduct simple random sampling of 20 students in a school with a population of 300 students to determine how many students are in each ride-share (carpool) on the way to school every day to get a good idea of who would use the app. the following data are collected: 6 5 5 5 3 2 3 6 2 2 5 4 3 3 4 2 5 3 4 5 construct a 95% confidence interval for the mean number of students who share a ride to school, and interpret the results. part a: state the parameter and check the conditions. part b: construct the confidence interval. be sure to show all your work, including the degrees of freedom, critical value, sample statistics, and an explanation of your process. part c: interpret the meaning of the confidence interval. part d: use your findings to explain whether you should develop the ride-share app for the football game.
Answers: 3
Do you know the correct answer?
Use the graph below to answer the following question:
what is the average rate of change from X=1...
Questions in other subjects:


Physics, 13.10.2020 01:01
Mathematics, 13.10.2020 01:01

Mathematics, 13.10.2020 01:01

Health, 13.10.2020 01:01


