

Mathematics, 29.09.2021 16:40, akai971
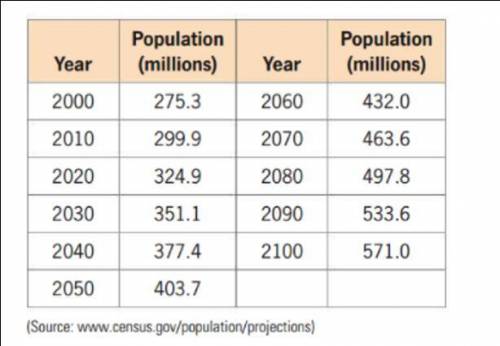
The following table gives projections of the U. S. population from 2000 to 2100.
a) Find a linear function that models the data (the equation of best fit) with x equal to the number of years after 2000 and f(x) equal to the population in millions.
Find f(65) and state what it means.
Find the slope of the line. What does it mean in the context of the problem?

Answers: 1


Other questions on the subject: Mathematics
Mathematics, 21.06.2019 23:00, eduardoma2902
Solve for x: 5/3 x = 20/21 it's fraction. remember to simplify your fraction
Answers: 2
Mathematics, 22.06.2019 00:00, lasardia
At a pizza shop 70% of the customers order a pizza 25% of the customers order a salad and 15% of the customers order both a pizza and a salad if s customer is chosen at random what is the probability that he or she orders either a pizza or a salad
Answers: 1
Do you know the correct answer?
The following table gives projections of the U. S. population from 2000 to 2100.
a) Find a linear...
Questions in other subjects:

English, 28.04.2021 21:20
Mathematics, 28.04.2021 21:20
Mathematics, 28.04.2021 21:20
English, 28.04.2021 21:20

Mathematics, 28.04.2021 21:20


