


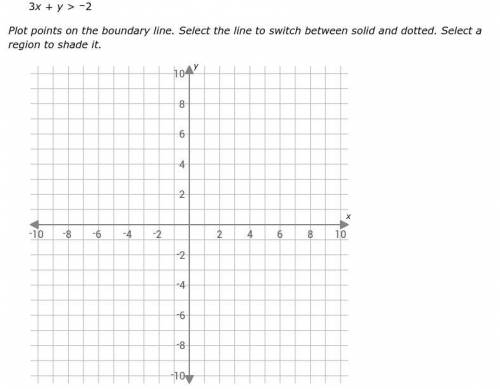
Graph this inequality:
3x + y > –2
Plot points on the boundary line. Select the lin...

Mathematics, 24.09.2021 01:20, Ramel360
Graph this inequality:
3x + y > –2
Plot points on the boundary line. Select the line to switch between solid and dotted. Select a region to shade it.

Answers: 2
Other questions on the subject: Mathematics
Mathematics, 21.06.2019 22:30, badpotterchris
60 musicians applied for a job at a music school. 14 of the musicians play both guitar and drums. what is the probability that the applicant who gets the job plays drums or guitar?
Answers: 1
Mathematics, 22.06.2019 00:30, hannahpalacios101
36x2 + 49y2 = 1,764 the foci are located at: a) (-√13, 0) and (√13,0) b) (0, -√13) and (0,√13) c) (-1, 0) and (1, 0)
Answers: 1
Mathematics, 22.06.2019 04:30, rockstargirl7256
Which graph or graphs appear to show a sinusoid? < me asap !
Answers: 1
Do you know the correct answer?
Questions in other subjects:

Mathematics, 27.11.2019 03:31
Mathematics, 27.11.2019 03:31

Mathematics, 27.11.2019 03:31

Physics, 27.11.2019 03:31

English, 27.11.2019 03:31


