

Mathematics, 20.09.2021 22:50, shaheedbrown06
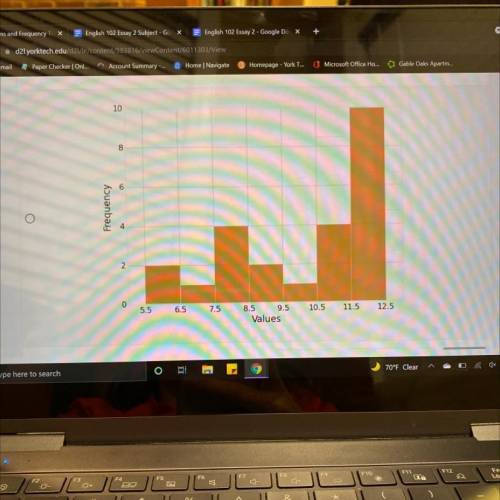
Randomly selected adults at a coffee shop were asked how many hours they work in a typical workday. The results are
tabulated in the following frequency table.
Which histogram accurately summarizes the data?
Value
Frequency
2
4
5
1
6
4
7
2
8
1
9
4
10
10
Select the correct answer below:

Answers: 2


Other questions on the subject: Mathematics
Mathematics, 21.06.2019 16:20, lethycialee2427
Taking algebra two apex courses and need with these questions
Answers: 1
Mathematics, 21.06.2019 18:00, queenofspades
Saline iv fluid bags cost $64.20 for 24, 1000 ml bags from one supplier. a new supplier sells 500 ml bags for $2 each. the hospital uses about 10,000, 1000 ml bags each month. nurses report that about half of the bags are more than half full when they are discarded. if you are going to use only one supplier, which size bag provides the best deal, and how much will you save each month? compare the cost of the new supplier to the current one.
Answers: 1
Mathematics, 21.06.2019 21:00, leannaadrian
2x minus y equals 6, x plus y equals negative 3
Answers: 1
Do you know the correct answer?
Randomly selected adults at a coffee shop were asked how many hours they work in a typical workday....
Questions in other subjects:
Mathematics, 04.03.2020 02:01


Mathematics, 04.03.2020 02:01


English, 04.03.2020 02:01
Mathematics, 04.03.2020 02:01


