

Mathematics, 16.09.2021 06:10, agray339
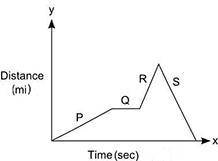
The graph shows the distance Maria traveled from home in miles (y) as a function of time in seconds (x). The graph is divided into four segments labeled P, Q, R, and S, respectively.
Which segment shows Maria waiting for a cab?
P
Q
R
S

Answers: 3


Other questions on the subject: Mathematics
Mathematics, 21.06.2019 15:30, makaylahendrix7954
Mary works for a company that ships packages and must measure the size of each box that needs to be shipped. mary measures a box and finds the length is 7 inches, the width is 14 inches, and the height is 15 inches. what is the volume of the box? [type your answer as a number.]
Answers: 1
Mathematics, 21.06.2019 22:30, clickbaitdxl
Pls never taught i’m really confused and i rlly need
Answers: 1
Mathematics, 21.06.2019 23:50, yarrito20011307
4. (10.03 mc) the equation of line cd is y = −2x − 2. write an equation of a line parallel to line cd in slope-intercept form that contains point (4, 5). (4 points) y = −2x + 13 y = negative 1 over 2 x + 7 y = negative 1 over 2 x + 3 − 2x − 3
Answers: 2
Do you know the correct answer?
The graph shows the distance Maria traveled from home in miles (y) as a function of time in seconds...
Questions in other subjects:

English, 17.02.2022 14:00


World Languages, 17.02.2022 14:00


