

Mathematics, 14.09.2021 21:10, bullockarwen
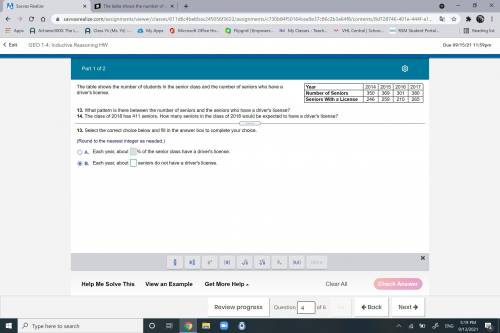
The table shows the number of students in the senior class and the number of seniors who have a driver's license.
13. What pattern is there between the number of seniors and the seniors who have a driver's license?
14. The class of 2018 has 411 seniors. How many seniors in the class of 2018 would be expected to have a driver's license?
13. Select the correct choice below and fill in the answer box to complete your choice.
(Round to the nearest integer as needed.)
A.
Each year, about
nothing% of the senior class have a driver's license.
B.
Each year, about
nothing seniors do not have a driver's license.

Answers: 1


Other questions on the subject: Mathematics
Mathematics, 22.06.2019 00:00, GERIANNCAYER
Aclothing designer is selecting models to walk the runway for her fashion show. the clothes she designed require each model’s height to be no more than y inches from 5 feet 10 inches, or 70 inches. which graph could be used to determine the possible variance levels that would result in an acceptable height, x?
Answers: 2
Do you know the correct answer?
The table shows the number of students in the senior class and the number of seniors who have a dri...
Questions in other subjects:

Social Studies, 05.11.2020 17:40


History, 05.11.2020 17:40

Geography, 05.11.2020 17:40


