

Mathematics, 01.09.2021 01:00, noneofurbznessp2yc11
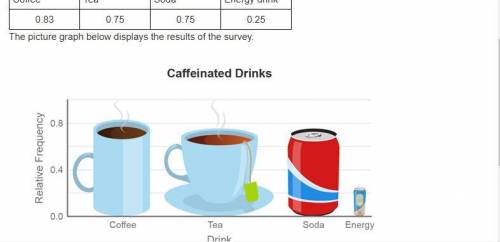
The relative frequency table displays the percentage of responses of students who were asked, "What caffeinated drinks do you consume?"
Coffee Tea Soda Energy drink
0.83 0.75 0.75 0.25
The picture graph below displays the results of the survey.
A graph titled Caffeinated Drinks has drink on the x-axis and relative frequency on the y-axis. Coffee, 0.8; tea, 0.75; Soda, 0.75; energy, 0.2. The coffee, tea, and soda pictures are large, and the energy drink picture is small.
Is this graph misleading?
No, because the pictures accurately represent the percentage of each type of drink.
No, because the height of each picture corresponds to the percentage of each type of drink.
Yes, because the height of each picture does not correspond to the percentage of each type of drink.
Yes, because the areas of the pictures do not accurately represent the proportions of each type of drink.

Answers: 3


Other questions on the subject: Mathematics
Mathematics, 21.06.2019 20:20, redbeast677
The polynomial 10x3 + 35x2 - 4x - 14 is factored by grouping. 10x3 + 35x2 - 4x - 14 5x )-20 what is the common factor that is missing from both sets of parentheses?
Answers: 2
Mathematics, 22.06.2019 00:30, cgonzalez1371
Find the area of just the wood portion of the frame. this is called a composite figure. you will need to use your values from problem #2need all exepct 4 answerd if you can
Answers: 1
Do you know the correct answer?
The relative frequency table displays the percentage of responses of students who were asked, "What...
Questions in other subjects:

English, 02.02.2021 01:20
Mathematics, 02.02.2021 01:20
Mathematics, 02.02.2021 01:20


Mathematics, 02.02.2021 01:20

History, 02.02.2021 01:20


