


3 points
Below are dot plots for three different data sets. The standard deviation for
these...

Mathematics, 31.08.2021 01:20, zoel222
3 points
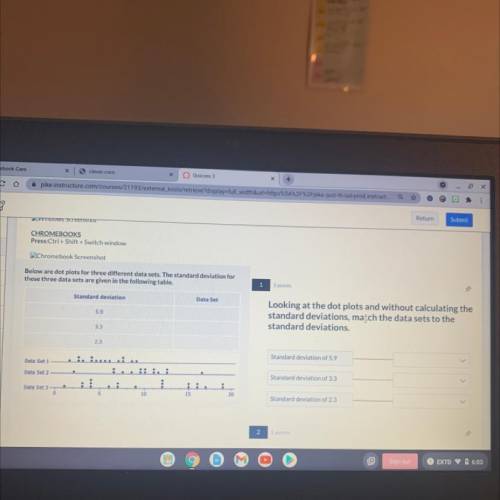
Below are dot plots for three different data sets. The standard deviation for
these three data sets are given in the following table.
Standard deviation
Data Set
59
Looking at the dot plots and without calculating the
standard deviations, match the data sets to the
standard deviations.
Standard deviation of 5.9
Da Sot
Data Set
Standard deviation of 3.3
Data Set
10
15
20
Standard deviation of 23

Answers: 2
Other questions on the subject: Mathematics
Mathematics, 21.06.2019 19:30, amanquen35
The pyramid below was dissected by a horizontal plane which shape describes the pyramid horizontal cross section
Answers: 1
Mathematics, 21.06.2019 22:30, NearNoodle23
Meghan has created a diagram of her city with her house, school, store, and gym identified. a. how far is it from the gym to the store? b. meghan also wants to walk to get some exercise, rather than going to the gym. she decides to walk along arc ab. how far will she walk? round to 3 decimal places.
Answers: 1
Do you know the correct answer?
Questions in other subjects:
Mathematics, 18.06.2021 09:10
Mathematics, 18.06.2021 09:10

Advanced Placement (AP), 18.06.2021 09:10

Social Studies, 18.06.2021 09:10


Social Studies, 18.06.2021 09:10
Mathematics, 18.06.2021 09:10
Mathematics, 18.06.2021 09:10


