

Mathematics, 30.08.2021 23:10, viviansotelo12
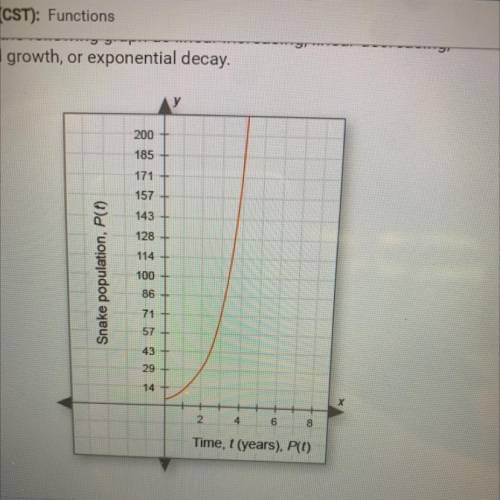
Categorize the following graph as linear increasing, linear decreasing,
exponential growth, or exponential decay.
200
185
171
157
143
128
114
Snake population, P(1)
100
86
71
57
43
29
14
2
4
6
8
Time, t (years), P(t)

Answers: 3


Other questions on the subject: Mathematics
Mathematics, 21.06.2019 14:30, shanicar33500
Find the value of tan theta if sin theta = 12/13 and theta is in quadrant 2
Answers: 1
Do you know the correct answer?
Categorize the following graph as linear increasing, linear decreasing,
exponential growth, or exp...
Questions in other subjects:

History, 20.09.2020 05:01


Spanish, 20.09.2020 05:01
Mathematics, 20.09.2020 05:01


Chemistry, 20.09.2020 05:01


