

Mathematics, 27.08.2021 16:40, Uc34758
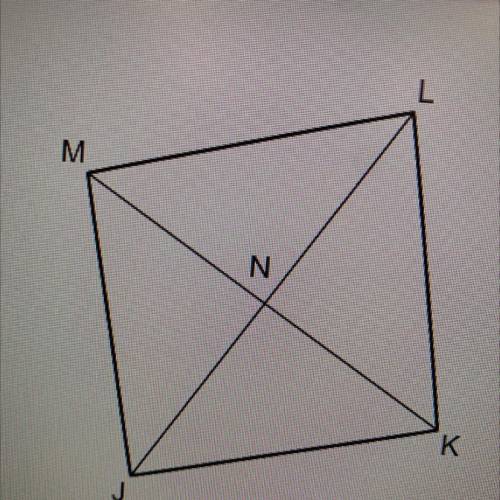
Which statements could you use to conclude that JKLM is a parallelogram?
LM=LK and JK=JM
MJ|LK and LM=LK
MN=KN and JN=LN

Answers: 1


Other questions on the subject: Mathematics
Mathematics, 21.06.2019 17:00, hsernaykaw42
Use the frequency distribution, which shows the number of american voters (in millions) according to age, to find the probability that a voter chosen at random is in the 18 to 20 years old age range. ages frequency 18 to 20 5.9 21 to 24 7.7 25 to 34 20.4 35 to 44 25.1 45 to 64 54.4 65 and over 27.7 the probability that a voter chosen at random is in the 18 to 20 years old age range is nothing. (round to three decimal places as needed.)
Answers: 1
Mathematics, 21.06.2019 23:00, kj44
Each of the following data sets has a mean of x = 10. (i) 8 9 10 11 12 (ii) 7 9 10 11 13 (iii) 7 8 10 12 13 (a) without doing any computations, order the data sets according to increasing value of standard deviations. (i), (iii), (ii) (ii), (i), (iii) (iii), (i), (ii) (iii), (ii), (i) (i), (ii), (iii) (ii), (iii), (i) (b) why do you expect the difference in standard deviations between data sets (i) and (ii) to be greater than the difference in standard deviations between data sets (ii) and (iii)? hint: consider how much the data in the respective sets differ from the mean. the data change between data sets (i) and (ii) increased the squared difference îł(x - x)2 by more than data sets (ii) and (iii). the data change between data sets (ii) and (iii) increased the squared difference îł(x - x)2 by more than data sets (i) and (ii). the data change between data sets (i) and (ii) decreased the squared difference îł(x - x)2 by more than data sets (ii) and (iii). none of the above
Answers: 2
Mathematics, 21.06.2019 23:30, claytonhopkins
In a study of the relationship between socio-economic class and unethical behavior, 129 university of california undergraduates at berkeley were asked to identify themselves as having low or high social-class by comparing themselves to others with the most (least) money, most (least) education, and most (least) respected jobs. they were also presented with a jar of individually wrapped candies and informed that the candies were for children in a nearby laboratory, but that they could take some if they wanted. after completing some unrelated tasks, participants reported the number of candies they had taken. it was found that those who were identiď¬ed as upper-class took more candy than others. in this study, identify: (a) the cases, (b) the variables and their types, (c) the main research question, (d) identify the population of interest and the sample in this study, and (e) comment on whether or not the results of the study can be generalized to the population, and if the ď¬ndings of the study can be used to establish causal relationships.
Answers: 2
Mathematics, 22.06.2019 00:30, mitchellmarquite
Ahovercraft takes off from a platform. its height (in meters), xx seconds after takeoff, is modeled by: h(x)=-2x^2+20x+48h(x)=−2x 2 +20x+48 what is the maximum height that the hovercraft will reach?
Answers: 3
Do you know the correct answer?
Which statements could you use to conclude that JKLM is a parallelogram?
LM=LK and JK=JM
Questions in other subjects:
Mathematics, 23.03.2020 21:30

Business, 23.03.2020 21:30
Mathematics, 23.03.2020 21:30

Arts, 23.03.2020 21:30

History, 23.03.2020 21:30
Mathematics, 23.03.2020 21:30
Mathematics, 23.03.2020 21:30


