)

step-by-step explanation :
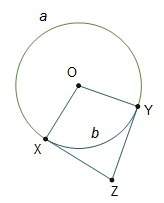
we know that
the measurement of the outer angle is the semi-difference of the arcs which comprises
in this problem
m< xzy is the outer angle
)
substitute the values
the measure of angle xoy is equal to
 > by central angle
substitute the value