

Mathematics, 22.08.2021 01:00, MidnightYT
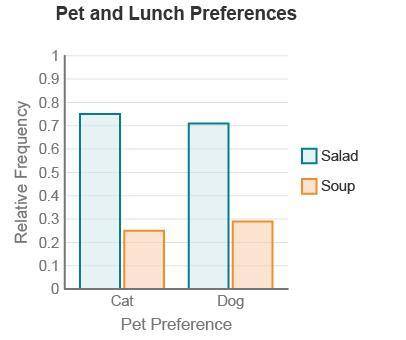
Several students were selected to participate in a two-question survey. They were asked if they prefer a cat or dog as a pet and if they prefer salad or soup for lunch. The results are displayed below.
Which of the following statements is true about the graph?
a) The percentage of people who prefer salad for lunch is larger for those who prefer dogs as pets.
b) The percentage of people who prefer soup for lunch is larger for those who prefer cats as pets.
c) The percentage of people who prefer salad for lunch is about the same no matter what their pet preference.
d) The percentage of people who prefer soup for lunch is smaller for those who prefer dogs as pets.

Answers: 2


Other questions on the subject: Mathematics
Mathematics, 22.06.2019 04:50, ramirezzairap2u4lh
The two cones below are similar. what is the height of the smaller cone?
Answers: 1
Do you know the correct answer?
Several students were selected to participate in a two-question survey. They were asked if they pref...
Questions in other subjects:

History, 11.06.2021 23:10
Mathematics, 11.06.2021 23:10


Mathematics, 11.06.2021 23:10
Mathematics, 11.06.2021 23:10


