

Mathematics, 18.08.2021 23:50, tanyadeewill
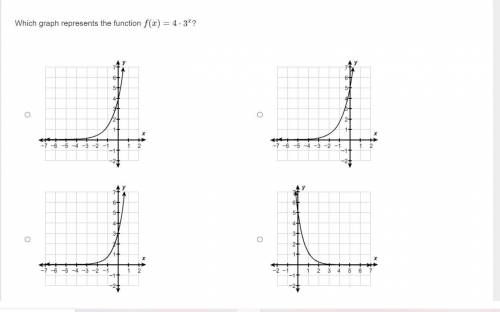
Which graph represents the function f(x)=4⋅3x? (See attachment for details and please don't just guess the answer if you don't actually know it.)

Answers: 1


Other questions on the subject: Mathematics
Mathematics, 22.06.2019 01:00, gomez36495983
If johnny ate 5 cans of sugar, but in the kitchen they only had 3. what did johnny eat? (he found a secret stash btw.)
Answers: 2
Mathematics, 22.06.2019 01:30, karsenbeau
Given are five observations for two variables, x and y. xi 1 2 3 4 5 yi 3 7 5 11 14 which of the following is a scatter diagrams accurately represents the data? what does the scatter diagram developed in part (a) indicate about the relationship between the two variables? try to approximate the relationship betwen x and y by drawing a straight line through the data. which of the following is a scatter diagrams accurately represents the data? develop the estimated regression equation by computing the values of b 0 and b 1 using equations (14.6) and (14.7) (to 1 decimal). = + x use the estimated regression equation to predict the value of y when x = 4 (to 1 decimal). =
Answers: 3
Mathematics, 22.06.2019 03:00, dominiqueallen23
Describe how the presence of possible outliers might be identified on the following. (a) histograms gap between the first bar and the rest of bars or between the last bar and the rest of bars large group of bars to the left or right of a gap higher center bar than surrounding bars gap around the center of the histogram higher far left or right bar than surrounding bars (b) dotplots large gap around the center of the data large gap between data on the far left side or the far right side and the rest of the data large groups of data to the left or right of a gap large group of data in the center of the dotplot large group of data on the left or right of the dotplot (c) stem-and-leaf displays several empty stems in the center of the stem-and-leaf display large group of data in stems on one of the far sides of the stem-and-leaf display large group of data near a gap several empty stems after stem including the lowest values or before stem including the highest values large group of data in the center stems (d) box-and-whisker plots data within the fences placed at q1 â’ 1.5(iqr) and at q3 + 1.5(iqr) data beyond the fences placed at q1 â’ 2(iqr) and at q3 + 2(iqr) data within the fences placed at q1 â’ 2(iqr) and at q3 + 2(iqr) data beyond the fences placed at q1 â’ 1.5(iqr) and at q3 + 1.5(iqr) data beyond the fences placed at q1 â’ 1(iqr) and at q3 + 1(iqr)
Answers: 1
Mathematics, 22.06.2019 06:30, LukeneedhelpInMath
Acircular swimming pool is 24 ft in diameter what is the circumference of the swimming pool
Answers: 1
Do you know the correct answer?
Which graph represents the function f(x)=4⋅3x?
(See attachment for details and please don't just g...
Questions in other subjects:
Mathematics, 24.11.2020 03:00
Mathematics, 24.11.2020 03:00


Health, 24.11.2020 03:00
Health, 24.11.2020 03:00

Physics, 24.11.2020 03:00
Mathematics, 24.11.2020 03:00


