


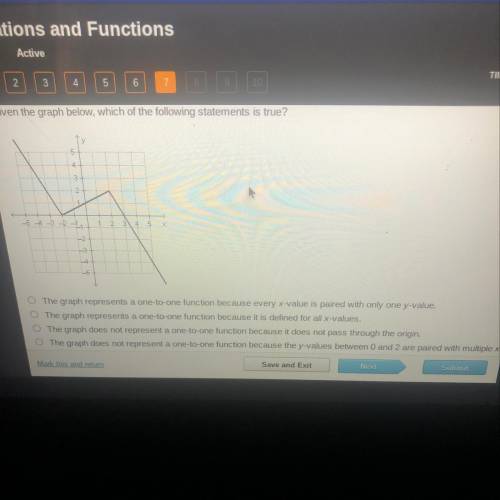
Given the graph below, which of the following statements is true?
5
4
3
1
...

Mathematics, 18.08.2021 17:50, sierram298
Given the graph below, which of the following statements is true?
5
4
3
1
_5_-24
-2 -14
2
4
5
-2
The graph represents a one-to-one function because every x-value is paired with only one y-value.
The graph represents a one-to-one function because it is defined for all x-values.
The graph does not represent a one-to-one function because it does not pass through the origin.
The graph does not represent a one-to-one function because the y-values between 0 and 2 are paired with multiple
Save and Exit
NEXT
Stab

Answers: 1
Other questions on the subject: Mathematics
Mathematics, 21.06.2019 20:00, lorip7799ov3qr0
The total number of dental clinics total for the last 12 months was recorded
Answers: 3
Mathematics, 21.06.2019 23:00, serenityburke
The areas of two similar triangles are 72dm2 and 50dm2. the sum of their perimeters is 226dm. what is the perimeter of each of these triangles?
Answers: 1
Do you know the correct answer?
Questions in other subjects:
Mathematics, 17.12.2020 20:50

Chemistry, 17.12.2020 20:50

Mathematics, 17.12.2020 20:50

English, 17.12.2020 20:50


Arts, 17.12.2020 20:50
Chemistry, 17.12.2020 20:50


