


What is the interquartile range (IQR) of the data set represented by this box
plot?
2
1...

Mathematics, 13.08.2021 05:50, rigobertogarza2
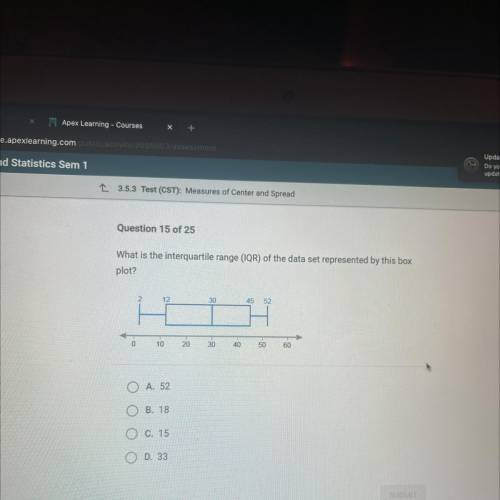
What is the interquartile range (IQR) of the data set represented by this box
plot?
2
12
30
45
52
0
0
10
20
30
40
50
60
O
A. 52
B. 18
O C. 15
O D. 33
SUBMIT

Answers: 3
Other questions on the subject: Mathematics
Mathematics, 21.06.2019 15:00, JayJay9439
Listed in the table is the percentage of students who chose each kind of juice at lunchtime. use the table to determine the measure of the central angle you would draw to represent orange juice in a circle graph
Answers: 3
Mathematics, 21.06.2019 18:30, natjojo0512
The monetary value earned for selling goods or services to customers is called a.) revenue b.) assets c.) money d.) accounting
Answers: 2
Mathematics, 21.06.2019 19:30, jrassicworld4ever
Need now max recorded the heights of 500 male humans. he found that the heights were normally distributed around a mean of 177 centimeters. which statements about max’s data must be true? a) the median of max’s data is 250 b) more than half of the data points max recorded were 177 centimeters. c) a data point chosen at random is as likely to be above the mean as it is to be below the mean. d) every height within three standard deviations of the mean is equally likely to be chosen if a data point is selected at random.
Answers: 1
Do you know the correct answer?
Questions in other subjects:

SAT, 14.01.2021 01:00

Mathematics, 14.01.2021 01:00

Spanish, 14.01.2021 01:00

History, 14.01.2021 01:00


Social Studies, 14.01.2021 01:00


