

Mathematics, 05.08.2021 21:30, gmanbom
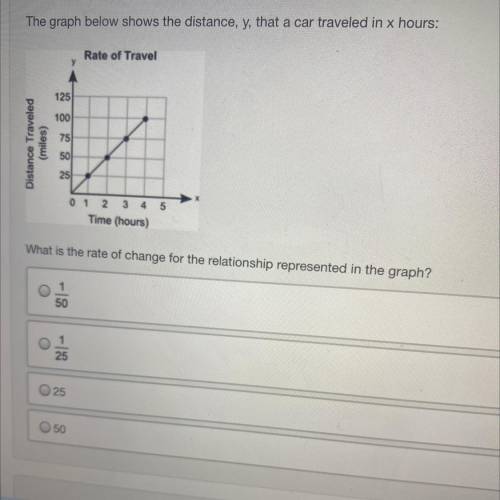
PLEASE HELP ME The graph below shows the distance, y, that a car traveled in x hours:
Rate of Travel
125
100
Distance Traveled
(miles)
75
501
251
0 1 2 3 4 5
Time (hours)
What is the rate of change for the relationship represented in the graph?
о
1
50
O
25
O 25
050

Answers: 1


Other questions on the subject: Mathematics
Mathematics, 21.06.2019 19:30, Animallover100
Write the sine and cosine values of a, b, respectively, in the figure for (1) and (2) + explanation.
Answers: 1
Do you know the correct answer?
PLEASE HELP ME The graph below shows the distance, y, that a car traveled in x hours:
Rate of Trave...
Questions in other subjects:

English, 27.10.2019 06:43

Biology, 27.10.2019 06:43


Computers and Technology, 27.10.2019 06:43

Social Studies, 27.10.2019 06:43


