

Mathematics, 04.08.2021 22:50, ehsaangaminglegend
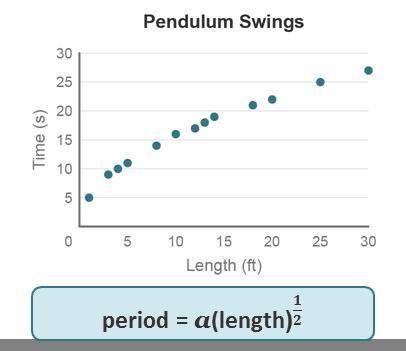
The scatterplot shows the relationship between the length of a pendulum and the time it takes to complete one full swing.
The Scatter plot is attached.
Which transformations would linearize these data using a power model? Check all that apply.
=
ln(Length), ln(Time)
ln(Length), Time
log(Length), log(Time)
Length, log(Time)
Length, Time2

Answers: 1


Other questions on the subject: Mathematics
Mathematics, 22.06.2019 04:30, alex12everett
Acheetah can run 70 per hour. what is the speed in feet per hour
Answers: 2
Do you know the correct answer?
The scatterplot shows the relationship between the length of a pendulum and the time it takes to com...
Questions in other subjects:
Mathematics, 20.03.2020 10:53


Physics, 20.03.2020 10:54


