

Mathematics, 01.08.2021 21:40, dedgefield
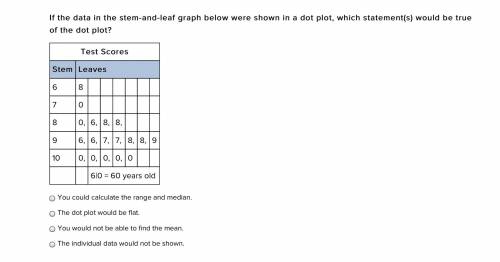
If the data in the stem-and-leaf graph below were shown in a dot plot, which statement(s) would be true of the dot plot?
Test Scores
Stem Leaves
6 8
7 0
8 0, 6, 8, 8,
9 6, 6, 7, 7, 8, 8, 9
10 0, 0, 0, 0, 0
6|0 = 60 years old
You could calculate the range and median.
The dot plot would be flat.
You would not be able to find the mean.
The individual data would not be shown.

Answers: 1


Other questions on the subject: Mathematics
Mathematics, 21.06.2019 17:00, nataliahenderso
Acylinder and its dimensions are shown. which equation can be used to find v, the volume of the cylinder in cubic centimeters?
Answers: 3
Mathematics, 21.06.2019 20:00, aliahauyon20
The rectangle shown has a perimeter of 108 cm and the given area. its length is 6 more than five times its width. write and solve a system of equations to find the dimensions of the rectangle.
Answers: 3
Mathematics, 21.06.2019 20:00, maddie53116
Formulate alisha has a number in mind. if she adds three to her number the result is less than five. use this information to write and solve an inequality about alisha's number. then graph the solution set.
Answers: 1
Do you know the correct answer?
If the data in the stem-and-leaf graph below were shown in a dot plot, which statement(s) would be t...
Questions in other subjects:


