

Mathematics, 28.07.2021 19:40, angel34emb
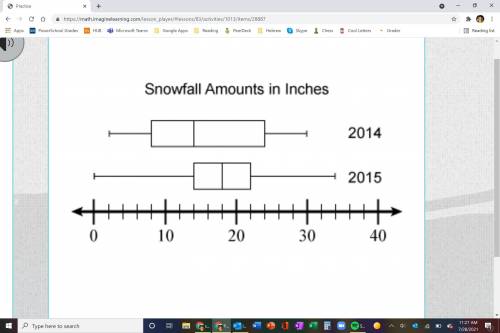
The box plots shown represent the snowfall amounts at a ski resort for two different years. Use the box plots to compare the data sets. Drag each value to show if it is greater for 2014, greater for 2015, or if there is not enough information to tell.


Answers: 2


Other questions on the subject: Mathematics
Mathematics, 21.06.2019 15:20, brittanyjacob8
Angle mno is s rotated 180 degrees counterclockwise about the origin to form angle m’n’o’. which statement shows the measure of angle m’n’o’?
Answers: 1
Mathematics, 21.06.2019 22:00, meg7211
There are 3232 forwards and 8080 guards in leo's basketball league. leo must include all players on a team and wants each team to have the same number of forwards and the same number of guards. if leo creates the greatest number of teams possible, how many guards will be on each team?
Answers: 2
Mathematics, 22.06.2019 02:30, EBeast7390
In one month jillian made 36 local phone calls and 20 long-distance calls what was her ratio of local calls to long-distance calls for that month?
Answers: 1
Do you know the correct answer?
The box plots shown represent the snowfall amounts at a ski resort for two different years. Use the...
Questions in other subjects:
Mathematics, 01.09.2019 16:20

Spanish, 01.09.2019 16:20


Arts, 01.09.2019 16:20


Biology, 01.09.2019 16:20


