


URGENT
The boxplot below displays the arm spans for 44 students.
A boxplot. A number line lab...

Mathematics, 27.07.2021 23:00, zoey1223
URGENT
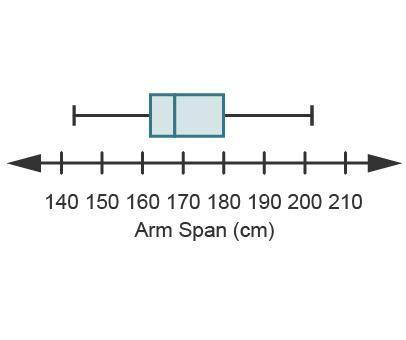
The boxplot below displays the arm spans for 44 students.
A boxplot. A number line labeled arm span (centimeters) goes from 140 to 210. The whiskers range from 142 to 202, and the box ranges 162 to 180. A line divides the box at 168.
The five-number summary for the data is 143, 162, 168, 180, and 202.
Which of the following is not a true statement?
Approximately 75% of the arm spans are less than 180 cm.
Approximately 50% of the arm spans are less than 168 cm.
Approximately 25% of the arm spans are less than 180 cm.
Approximately 75% of the arm spans are greater than 162 cm.

Answers: 3
Other questions on the subject: Mathematics
Mathematics, 21.06.2019 17:00, joelpimentel
Asailor is looking at a kite. if he is looking at the kite at an angle of elevation of 36and the distance from the boat to the point where the kite is directly overhead is 40 feet, how high is the kite?
Answers: 3
Mathematics, 21.06.2019 17:30, victordhernandez01
Nick and nora are married and have three children in college. they have an adjusted gross income of 47,400. if their standard deduction is 12,600 itemized deductions are 14,200 and they get an exemption of 4000 for each adult and each dependent what is their taxable income
Answers: 3
Mathematics, 21.06.2019 19:30, bxbykyah
You have learned about the six trigonometric functions, their definitions, how to use them, and how to represent them graphically. the sine, cosine, and tangent trigonometric functions can be paired with their reciprocal functions, cosecant, secant, and cotangent, respectively. think about how each function is related to its reciprocal function. how are the graphs of the reciprocal functions related to their corresponding original functions? what happens to the graphs of the reciprocal functions as x approaches the zeros of the original functions? describe how you would teach friends with different learning styles (visual-spatial, aural-auditory, verbal-linguistic, physical-bodily-kinesthetic, logical-mathematical, social-interpersonal, and solitary-intrapersonal) how to graph the reciprocal functions
Answers: 2
Mathematics, 21.06.2019 22:00, anastasiakonni1
Jayne is studying urban planning and finds that her town is decreasing in population by 3% each year. the population of her town is changing by a constant rate. true or false?
Answers: 3
Do you know the correct answer?
Questions in other subjects:
Mathematics, 07.04.2020 02:37


