


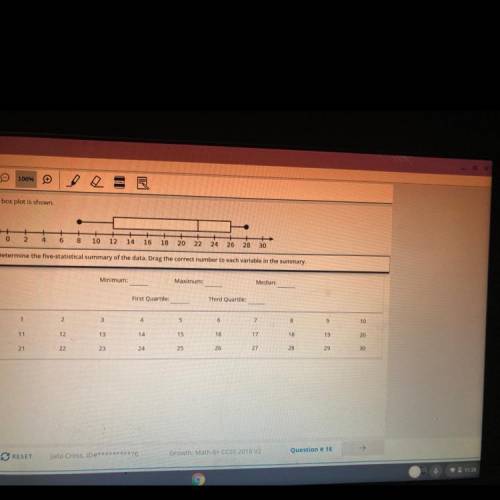
A box plot is shown
O
2
4
6
8
10
12
Determine the five-st...

Mathematics, 27.07.2021 19:40, Fvmousdj5
A box plot is shown
O
2
4
6
8
10
12
Determine the five-statistical summary of the data. Drag the correct number to each variable in the summary.
14
16
18
20
22 24 26
28
30
Minimum:
Maximum:
Median:
First Quartile:
Third Quartile:
1
2
3
4
11
5
12
6
ما تا ته
13
14
8
21
15
22
16
10
23
17
24
18
25
19
26
20
27
28
29
30
Please answer fast

Answers: 3
Other questions on the subject: Mathematics
Mathematics, 21.06.2019 18:10, lupitasalas9283
Josh has a rewards card for a movie theater he receives 15 points for becoming a rewards card holder he earns 3.5 points for each visit to the movie theater he needs at least 55 points to earn a free movie ticket which inequality can josh use to determine x, the minimum number of visits he needs to earn his first free movie ticket.
Answers: 1
Mathematics, 21.06.2019 23:40, asiababbie33
Agrid shows the positions of a subway stop and your house. the subway stop is located at (-5,2) and your house is located at (-9,9). what is the distance, to the nearest unit, between your house and the subway stop?
Answers: 1
Mathematics, 22.06.2019 00:30, andy963936
The measures of two supplementary angles are (2x + 10)° and (8x + 10)°. what is the measure of the larger angle? a. 16° b. 44° c. 14° d. 138°
Answers: 2
Do you know the correct answer?
Questions in other subjects:


Mathematics, 19.11.2020 19:40


History, 19.11.2020 19:40

Chemistry, 19.11.2020 19:40
Mathematics, 19.11.2020 19:40
Mathematics, 19.11.2020 19:40
Mathematics, 19.11.2020 19:40


