


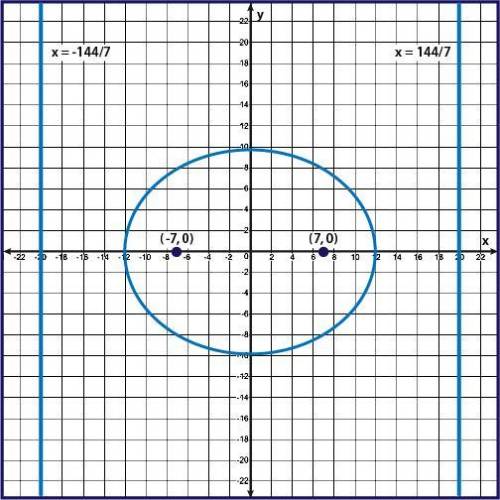
Which of the following is the equation for the graph shown?
A.) x² / 144 + y² / 95 = 1
...

Mathematics, 27.07.2021 18:30, Delaeney9192
Which of the following is the equation for the graph shown?
A.) x² / 144 + y² / 95 = 1
B.) x² / 144 - y² / 95 = 1
C.) x² / 95 + y² / 144 = 1
D.) x² / 95 - y² / 144 = 1

Answers: 2
Other questions on the subject: Mathematics
Mathematics, 21.06.2019 18:30, mikey8510
The median of a data set is the measure of center that is found by adding the data values and dividing the total by the number of data values that is the value that occurs with the greatest frequency that is the value midway between the maximum and minimum values in the original data set that is the middle value when the original data values are arranged in order of increasing (or decreasing) magnitude
Answers: 3
Mathematics, 21.06.2019 21:30, Reebear1447
Abicycle training wheel has a radius of 3 inches. the bicycle wheel has a radius of 10 inches. approximately how much smaller, in square inches and rounded to the nearest hundredth, is the area of the training wheel than the area of the regular wheel? *
Answers: 3
Mathematics, 22.06.2019 01:00, ryantrajean7
The collection of beautiful oil paintings currently on display at an art gallery well defined; set not well defined; not a set
Answers: 2
Do you know the correct answer?
Questions in other subjects:

Mathematics, 22.07.2019 13:30


Computers and Technology, 22.07.2019 13:30


