

Mathematics, 27.07.2021 06:20, angelina6836
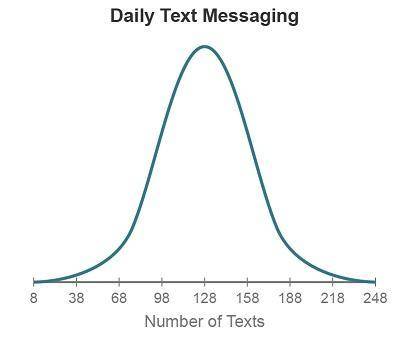
The graph shows the distribution of the number of text messages young adults send per day. The distribution is approximately Normal, with a mean of 128 messages and a standard deviation of 30 messages.
A graph titled daily text messaging has number of text on the x-axis, going from 8 to 248 in increments of 30. Data is distributed normally. The highest point of the curve is at 128.
What percentage of young adults send between 68 and 158 text messages per day?
34%
47.5%
81.5%
95%

Answers: 2


Other questions on the subject: Mathematics
Mathematics, 21.06.2019 17:30, kruzyoungblood8
When a rectangle is dilated, how do the perimeter and area of the rectangle change?
Answers: 2
Mathematics, 21.06.2019 19:10, gurlnerd
1jessica's home town is a mid-sized city experiencing a decline in population. the following graph models the estimated population if the decline continues at the same rate. select the most appropriate unit for the measure of time that the graph represents. a. years b. hours c. days d. weeks
Answers: 2
Mathematics, 21.06.2019 22:30, gilcarrillo146
Micheal is 4 times as old as brandon and is also 27 years older than brandon. how old is micheal
Answers: 2
Mathematics, 22.06.2019 02:00, castellon67
The half-life of a certain material is 0.004 second. approximately how much of a 20-gram sample will be left after 0.016 second? a. 5 grams b. 16 grams c. 0.32 gram d. 1.25 grams
Answers: 3
Do you know the correct answer?
The graph shows the distribution of the number of text messages young adults send per day. The distr...
Questions in other subjects:

Social Studies, 16.07.2020 01:01
Mathematics, 16.07.2020 01:01
Mathematics, 16.07.2020 01:01

English, 16.07.2020 01:01
Mathematics, 16.07.2020 01:01


