

Mathematics, 27.07.2021 06:10, kingnya63
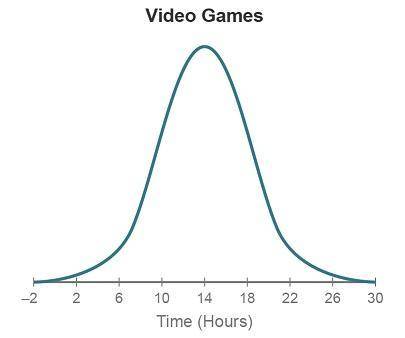
The graph shows the distribution of lengths of songs (in seconds). The distribution is approximately Normal, with a mean of 227 seconds and a standard deviation of 31 seconds.
A graph titled Song length has length (seconds) on the x-axis, going from 103 to 351 in increments of 31. The highest point of the curve is at 227.
What percentage of songs have lengths that are within 31 seconds of the mean?
34%
68%
95%
99.7%

Answers: 2


Other questions on the subject: Mathematics
Mathematics, 21.06.2019 15:00, awkwardness92
You put the following items into your rucksack. ham 600 g cheese 380 g tomatoes 270 g how much do all the ingredients weigh in total?
Answers: 1
Mathematics, 21.06.2019 16:20, lethycialee2427
Taking algebra two apex courses and need with these questions
Answers: 1
Mathematics, 21.06.2019 20:30, GreenHerbz206
Tom is the deli manager at a grocery store. he needs to schedule employee to staff the deli department for no more that 260 person-hours per week. tom has one part-time employee who works 20 person-hours per week. each full-time employee works 40 person-hours per week. write and inequality to determine n, the number of full-time employees tom may schedule, so that his employees work on more than 260 person-hours per week. graph the solution set to this inequality.
Answers: 1
Mathematics, 21.06.2019 21:30, peytonamandac9114
Ahypothesis is: a the average squared deviations about the mean of a distribution of values b) an empirically testable statement that is an unproven supposition developed in order to explain phenomena a statement that asserts the status quo; that is, any change from what has been c) thought to be true is due to random sampling order da statement that is the opposite of the null hypothesis e) the error made by rejecting the null hypothesis when it is true
Answers: 2
Do you know the correct answer?
The graph shows the distribution of lengths of songs (in seconds). The distribution is approximately...
Questions in other subjects:

Geography, 06.12.2019 03:31
Mathematics, 06.12.2019 03:31

English, 06.12.2019 03:31
Mathematics, 06.12.2019 03:31

History, 06.12.2019 03:31

Biology, 06.12.2019 03:31
History, 06.12.2019 03:31
Biology, 06.12.2019 03:31


