


Part A
Using the stock information found during your research, complete the table.
Part...

Mathematics, 24.07.2021 20:10, lindasuebairdoyjpf7
Part A
Using the stock information found during your research, complete the table.
Part B
Use the information you’ve gathered about the stock to answer these questions.
Question 1
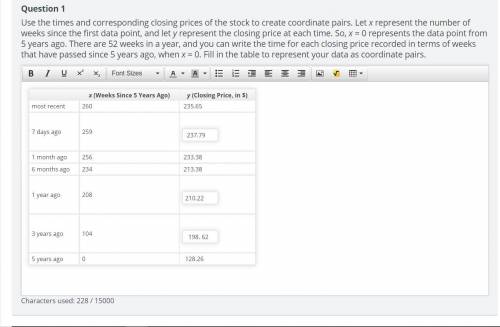
Use the times and corresponding closing prices of the stock to create coordinate pairs. Let x represent the number of weeks since the first data point, and let y represent the closing price at each time. So, x = 0 represents the data point from 5 years ago. There are 52 weeks in a year, and you can write the time for each closing price recorded in terms of weeks that have passed since 5 years ago, when x = 0. Fill in the table to represent your data as coordinate pairs.
Question 2
Open the graphing tool, and select the data tab. Copy and paste your data from the table (x- and y-coordinates). Don’t include any dollar signs. Plot the data on the graph.
Under the relationship tab, use the linear, exponential, and quadratic function tools with “best fit” selected to view the regression model. Zooming in and out will help you get a better view of each fit. Observe how well each model fits the data. Rank the three function types (linear, exponential, quadratic) in order from best fit to worst fit.
Question 3
Write two to three sentences justifying your reasoning for the ranking you chose in question 2.
Part C
Stock values for a certain company are recorded in the table.
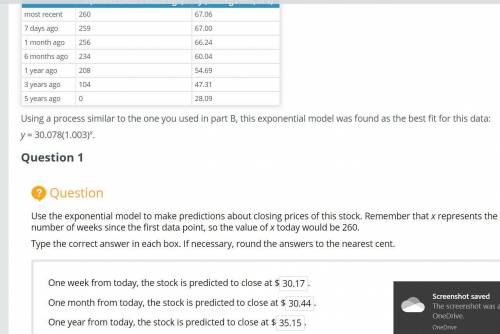
Using a process similar to the one you used in part B, this exponential model was found as the best fit for this data:
y = 30.078(1.003)x.
Use the exponential model to make predictions about closing prices of this stock. Remember that x represents the number of weeks since the first data point, so the value of x today would be 260.
Type the correct answer in each box. If necessary, round the answers to the nearest cent.
Do you think the model is a good predictor of the future closing price of the stock? Justify your response in three to four sentences.


Answers: 1
Other questions on the subject: Mathematics
Mathematics, 21.06.2019 16:30, dimpleschris101
Marco is studying a type of mold that grows at a fast rate. he created the function f(x) = 345(1.30)x to model the number of mold spores per week. what does the 1.30 represent? how many mold spores are there after 4 weeks? round your answer to the nearest whole number. 1.30 represents the number of mold spores marco had at the beginning of the study; 985 mold spores 1.30 represents the number of mold spores grown in a given week; 448 mold spores 1.30 represents the 30% rate of weekly growth; 345 mold spores 1.30 represents the 30% rate of weekly growth; 985 mold spores
Answers: 1
Mathematics, 21.06.2019 18:30, 2024daisjavien
For this option, you will work individually. the pythagorean theorem can be used in many real-world scenarios. part 1 write your own real-world scenario where the pythagorean theorem can be applied to find a missing piece. you may choose to write a problem that is two- or three-dimensional in nature. be sure that you will be able to draw a diagram of your scenario. write out your problem and submit it for part 1. be sure to end your scenario with a question. part 2 draw a diagram of the scenario you created in part 1. you may draw by hand and scan and upload your drawing or create a computer-generated drawing for submission. be sure to label all parts and dimensions of the drawing. part 3 solve the question that you posed in part 1. show all of your steps in answering the question. for this option, you will need to submit all three parts for full credit—your real-world problem and question, the diagram that you created, and your work solving the problem, showing all steps. * note that your instructor is looking for your own original idea. while it is acceptable to use the internet for research and inspiration, academic integrity policies apply.
Answers: 1
Mathematics, 22.06.2019 00:30, andrejr0330jr
Which equation represents h for right triangle abc
Answers: 3
Do you know the correct answer?
Questions in other subjects:

History, 24.09.2020 07:01

History, 24.09.2020 07:01

Mathematics, 24.09.2020 07:01


