

Mathematics, 24.07.2021 14:40, miahsmith258
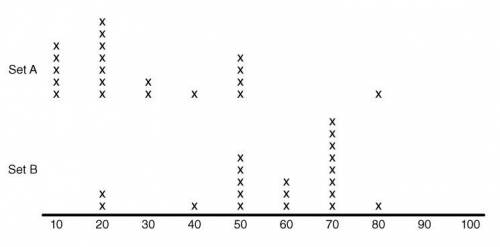
The following dot plot represents two data sets, A and B. The mean of set B is about _ (40, 50, 30) higher than the means of set A, which is about _ (half, twice, the same as) the mean absolute deviation of either set.

Answers: 3


Other questions on the subject: Mathematics
Mathematics, 21.06.2019 18:10, lupitasalas9283
Josh has a rewards card for a movie theater he receives 15 points for becoming a rewards card holder he earns 3.5 points for each visit to the movie theater he needs at least 55 points to earn a free movie ticket which inequality can josh use to determine x, the minimum number of visits he needs to earn his first free movie ticket.
Answers: 1
Mathematics, 22.06.2019 00:10, evryday2285
Sasha delivers newspapers to subscribers that live within a 4 block radius of her house. sasha's house is located at point (0, -1). points a, b, c, d, and e represent the houses of some of the subscribers to the newspaper. to which houses does sasha deliver newspapers?
Answers: 1
Do you know the correct answer?
The following dot plot represents two data sets, A and B.
The mean of set B is about _ (40, 50, 30)...
Questions in other subjects:

Biology, 04.08.2019 13:00
Biology, 04.08.2019 13:00
Mathematics, 04.08.2019 13:00

Chemistry, 04.08.2019 13:00

Social Studies, 04.08.2019 13:00
Mathematics, 04.08.2019 13:00

History, 04.08.2019 13:00


