

Mathematics, 22.07.2021 22:20, unruhlsY25
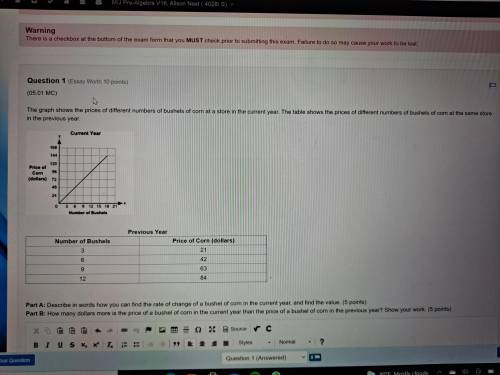
The graph shows the prices of different numbers of bushels of corn at a store in the current year. The table shows the prices of different numbers of bushels of corn at the same store in the previous year.
A graph shows Number of Bushels on x-axis and Price of Corn in dollars on y-axis. The x-axis scale is shown from 0 to 21 at increments of 3, and the y-axis scale is shown from 0 to 168 at increments of 24. A straight line joins the ordered pairs 3, 24 and 6, 48 and 9, 72 and 12, 96 and 15, 120 and 18, 144.
Previous Year
Number of Bushels
Price of Corn (dollars)
3
21
6
42
9
63
12
84
Part A: Describe in words how you can find the rate of change of a bushel of corn in the current year, and find the value. (5 points)
Part B: How many dollars more is the price of a bushel of corn in the current year than the price of a bushel of corn in the previous year? Show your work. (5 points)

Answers: 2


Other questions on the subject: Mathematics
Mathematics, 21.06.2019 15:00, voldermort9695
With these: 18/36 = 1/? missing number change 1 5/8 to improper fraction. change 19/5 to a mixed number.
Answers: 1
Mathematics, 21.06.2019 19:00, ashrobbb
The annual snowfall in a town has a mean of 38 inches and a standard deviation of 10 inches. last year there were 63 inches of snow. find the number of standard deviations from the mean that is, rounded to two decimal places. 0.44 standard deviations below the mean 2.50 standard deviations below the mean 0.44 standard deviations above the mean 2.50 standard deviations above the mean
Answers: 3
Mathematics, 21.06.2019 20:30, jmcd10
Create a question with this scenario you could ask that could be answered only by graphing or using logarithm. david estimated he had about 20 fish in his pond. a year later, there were about 1.5 times as many fish. the year after that, the number of fish increased by a factor of 1.5 again. the number of fish is modeled by f(x)=20(1.5)^x.
Answers: 1
Do you know the correct answer?
The graph shows the prices of different numbers of bushels of corn at a store in the current year. T...
Questions in other subjects:
Mathematics, 21.11.2020 01:50

Computers and Technology, 21.11.2020 01:50
Computers and Technology, 21.11.2020 01:50

Biology, 21.11.2020 01:50
Biology, 21.11.2020 01:50
Mathematics, 21.11.2020 01:50
Mathematics, 21.11.2020 01:50


