

Mathematics, 20.07.2021 20:20, simegustachocolate
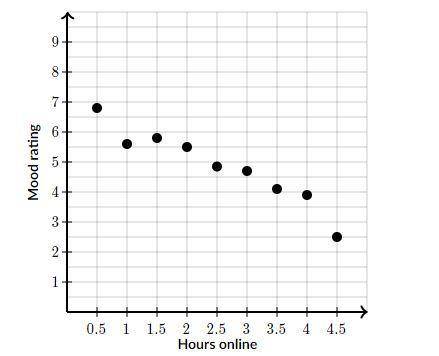
Jacob distributed a survey to his fellow students asking them how many hours they spent on the Internet in the past day. He also asked them to rate their mood on a scale from 0 to 10, with 10 being the happiest.
The scatter plot below shows the mood rating for each amount of time online.
Which of the following is the best estimate of the average change in mood rating associated with a 1 hour increase in hours online?
A. -4 points
B. -2 points
C. -1 point
D. -1/2 point

Answers: 2


Other questions on the subject: Mathematics
Mathematics, 21.06.2019 15:00, camila9022
Can someone answer it, and plot it, for 20 points and brainliest answer? p. s. they're the same ! : )
Answers: 1
Mathematics, 22.06.2019 00:00, dragonslayer321
Yvaries inversely as x. y =12 when x=5. find y when x=4
Answers: 2
Mathematics, 22.06.2019 00:20, kaybec2386
Data for the height of a model rocket launch in the air over time are shown in the table. darryl predicted that the height of the rocket at 8 seconds would be about 93 meters. did darryl make a good prediction? yes, the data are best modeled by a quadratic function. the value of the function at 8 seconds is about 93 meters. yes, the data are best modeled by a linear function. the first differences are constant, so about 93 meters at 8 seconds is reasonable. no, the data are exponential. a better prediction is 150 meters. no, the data are best modeled by a cubic function. a better prediction is 100 meters.
Answers: 2
Do you know the correct answer?
Jacob distributed a survey to his fellow students asking them how many hours they spent on the Inter...
Questions in other subjects:


Advanced Placement (AP), 06.01.2021 07:40

Chemistry, 06.01.2021 07:40

English, 06.01.2021 07:40


