

Mathematics, 18.07.2021 05:50, ddmoorehouseov75lc
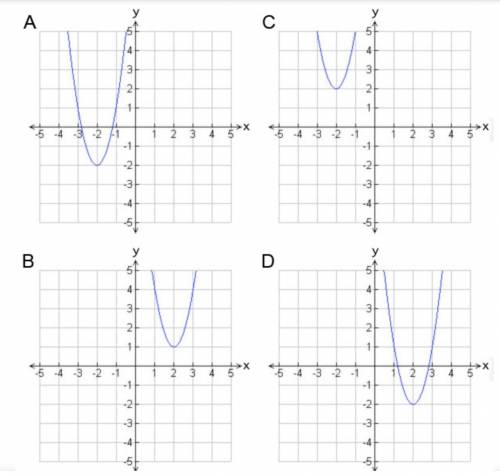
Which graph shows the quadratic function y = 3x2 + 12x + 10? (5 points) The following graph is labeled A: A four quadrant graph with a parabola opening up, passing through the points negative 3, 1, negative 2, negative 2, and negative 1, 1 with the vertex at 2, negative 2. The following graph is labeled B: A four quadrant graph with a parabola opening up, passing through the points 1, 4, 2, 1, and 3, 4 with the vertex at 2, 1. The following graph is labeled C: A four quadrant graph with a parabola opening up, passing through the points negative 3, 5, negative 2, 2, and negative 1, 5 with the vertex at negative 2, 2. The following graph is labeled D: A four quadrant graph with a parabola opening up, passing through the points 1, 1, 2, negative 2, and 3, 1 with the vertex at 2, negative 2.

Answers: 2


Other questions on the subject: Mathematics
Mathematics, 21.06.2019 19:10, jemseidle8889
Click an item in the list or group of pictures at the bottom of the problem and, holding the button down, drag it into the correct position in the answer box. release your mouse button when the item is place. if you change your mind, drag the item to the trashcan. click the trashcan to clear all your answers. solve this quadratic equation using the quadratic formula. 2x2 - 2x=1 need asap
Answers: 2
Mathematics, 22.06.2019 03:20, arangoaiden71
Aconcession manager at yankee stadium wants to know how temperature affects beer sales. she took a sample of 10 games and recorded the number of beers sold and the temperature in the middle of the game. temperature 80 68 78 79 87 74 86 92 77 84 number of beers 20533 1439 13829 21286 30985 17187 30240 87596 9610 28742 a. draw a scatter plot of the data. b. the manager estimates the regression equation to be: numberofbeers = −100, 678 + 1, 513 ∗ temperature draw this on your scatter plot. c. for one of the estimated points, indicate the residual with ei . d. for that same point, indicate what part of the variation is explained by the model with ˆyi − y¯.
Answers: 2
Mathematics, 22.06.2019 04:10, elpeke102p73fz3
Find the tenth term in the following geometric sequence. 8, 4, 2, 1, . .a) 13b) 0.0078c) 0.0156d) 12.5
Answers: 2
Mathematics, 22.06.2019 04:30, alex12everett
Acheetah can run 70 per hour. what is the speed in feet per hour
Answers: 2
Do you know the correct answer?
Which graph shows the quadratic function y = 3x2 + 12x + 10? (5 points)
The following graph is labe...
Questions in other subjects:
Mathematics, 20.08.2019 04:00

Mathematics, 20.08.2019 04:00
Mathematics, 20.08.2019 04:00

Biology, 20.08.2019 04:00

Mathematics, 20.08.2019 04:00


