

Mathematics, 15.07.2021 19:20, madisonsimmons1120
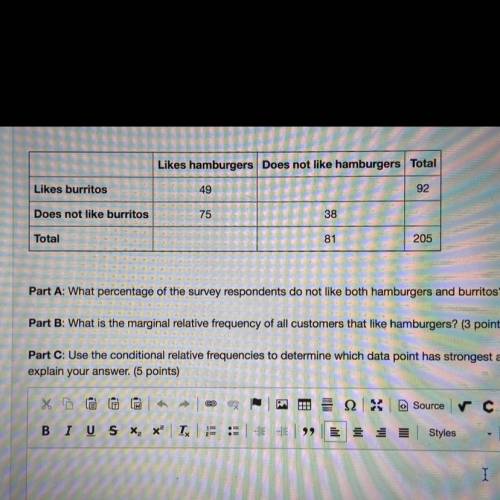
A food truck did a daily survey of customers to find their food preferences. The data is partially entered in the frequency table. Complete the table to
analyze the data and answer the questions:
Likes hamburgers Does not like hamburgers Total
Likes burritos
49
92
Does not like burritos
75
38
Total
81
205
Part A: What percentage of the survey respondents do not like both hamburgers and burritos? (2 points)
Part B: What is the marginal relative frequency of all customers that like hamburgers? (3 points)
Part C: Use the conditional relative frequencies to determine which data point has strongest association of its two factors. Use complete sentences to
explain your answer. (5 points)

Answers: 2


Other questions on the subject: Mathematics
Mathematics, 21.06.2019 22:30, jakails359
Atotal of 766 tickets were sold for the school play. they were either adult tickets or student tickets. there were 66 more student tickets sold than adult tickets. how many adult tickets were sold?
Answers: 1
Mathematics, 22.06.2019 03:00, wypozworski
Finally, the arena decides to offer advertising space on the jerseys of the arena's own amateur volley ball team. the arena wants the probability of being shortlisted to be 0.14 what is this as a percentage? what is this as a fraction? what is the probability of not being shortlisted? give your answer as a decimal.
Answers: 3
Do you know the correct answer?
A food truck did a daily survey of customers to find their food preferences. The data is partially e...
Questions in other subjects:

Mathematics, 11.07.2019 22:00
History, 11.07.2019 22:00
Mathematics, 11.07.2019 22:00

Mathematics, 11.07.2019 22:00


