

Mathematics, 14.07.2021 21:50, angie249
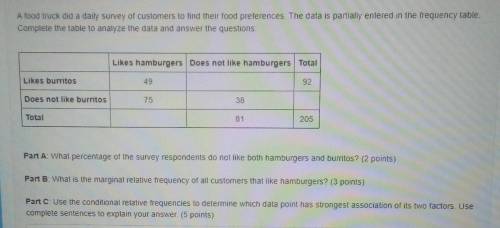
A food truck did a daily survey of customers to find their food preferences. The data is partially entered in the frequency table. Complete the table to analyze the data and answer the questions: Likes hamburgers Does not like hamburgers Total Likes burritos 49 92 Does not like burritos 75 38 Total 81 205 Part A: What percentage of the survey respondents do not like both hamburgers and burritos? (2 points) Part B: What is the marginal relative frequency of all customers that like hamburgers? (3 points) Part C: Use the conditional relative frequencies to determine which data point has strongest association of its two factors. Use complete sentences to explain your answer. (5 points)

Answers: 1


Other questions on the subject: Mathematics
Mathematics, 21.06.2019 12:30, victoria6929
Convert 16 yards to feet use the conversion rate 3 feet = 1 yard
Answers: 2
Mathematics, 21.06.2019 14:30, imlexi12393
Translate the following situation into an inequality statement . lily has $25 to spend on a charm bracelet for her sisters birthday gift the cost of the bracelet is $12 plus $1.50 per charm
Answers: 1
Mathematics, 21.06.2019 16:30, alexialoredo625
Anyone know? will mark brainliest if correct
Answers: 1
Mathematics, 21.06.2019 17:30, tristan4233
Noor brought 21 sheets of stickers. she gave 1/3 of a sheet to each of the 45 students at recess. she wants to give teachers 1 1/2 sheets each.
Answers: 2
Do you know the correct answer?
A food truck did a daily survey of customers to find their food preferences. The data is partially e...
Questions in other subjects:
Mathematics, 27.05.2020 19:09


Mathematics, 27.05.2020 19:10


