

Mathematics, 14.07.2021 14:00, lovemusic4
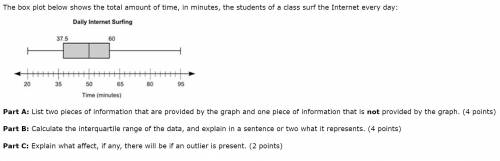
The box plot below shows the total amount of time, in minutes, the students of a class surf the Internet every day:
A box plot is shown. The left-most point on the plot is 20 and the right-most point is 95. The box is labeled 37.5 on the left edge and 60 on the right edge. A vertical line is drawn inside the rectangle at the point 50.
Part A: List two pieces of information that are provided by the graph and one piece of information that is not provided by the graph. (4 points)
Part B: Calculate the interquartile range of the data, and explain in a sentence or two what it represents. (4 points)
Part C: Explain what affect, if any, there will be if an outlier is present. (2 points)

Answers: 3


Other questions on the subject: Mathematics
Mathematics, 21.06.2019 16:30, gerardoblk5931
Triangle inequality theorem state if each set of three numbers can be the lengths of the sides of a triangle. 1. 9, 8, 22. 2. 5,10,12. 3. 7,10,22. 4. 4,11,12. 5. 11,9,10. 6. 10,4,19. 7. 3,12,10. 8. 4,3,2. 9. 6,5,13. 10. 7,12,20. me .
Answers: 3
Mathematics, 21.06.2019 22:20, macycj8
1. 2. ∠b and ∠y are right angles. 3.? 4.? which two statements are missing in steps 3 and 4? ∠x ≅ ∠c △abc ~ △zyx by the sas similarity theorem. ∠b ≅ ∠y △abc ~ △zyx by the sas similarity theorem. = 2 △abc ~ △zyx by the sss similarity theorem. = 2 △abc ~ △zyx by the sss similarity theorem.
Answers: 2
Do you know the correct answer?
The box plot below shows the total amount of time, in minutes, the students of a class surf the Inte...
Questions in other subjects:

Social Studies, 10.02.2021 16:30


Mathematics, 10.02.2021 16:30

English, 10.02.2021 16:30

Physics, 10.02.2021 16:30

Arts, 10.02.2021 16:30


