

Mathematics, 13.07.2021 15:50, baca23jasmine
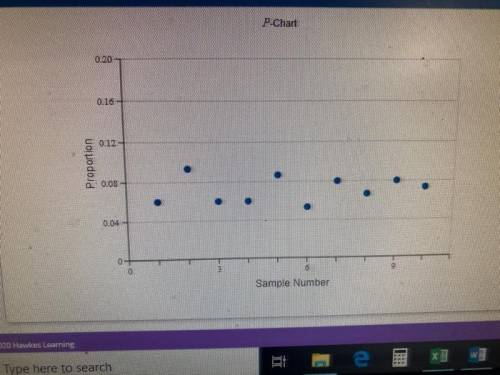
William's assembly unit has decided to use a p-Chart with 2-sigma control limits to monitor the proportion of defective castings produced by their production process. The quality control manager randomly samples 150 castings at 10 successively selected time periods and counts the number of defective castings in the sample.
Sample Defects
1 9
2 14
3 9
4 9
5 13
6 8
7 12
8 10
9 12
10 11
Required:
a. What is the Center Line of the control chart?
b. What value of z should be used to construct the control chart?
c. What is the Upper Control Limit?
d. What is the Lower Control Limit?

Answers: 3


Other questions on the subject: Mathematics
Mathematics, 21.06.2019 18:40, ariloveshorses
Which statements regarding efg are true? check all that apply.
Answers: 1
Mathematics, 21.06.2019 18:40, reggie1127
Christina can paint 420 square feet in 105 minutes. which unit rate describes the scenario?
Answers: 1
Do you know the correct answer?
William's assembly unit has decided to use a p-Chart with 2-sigma control limits to monitor the prop...
Questions in other subjects:

History, 21.06.2019 23:00
Mathematics, 21.06.2019 23:00
Mathematics, 21.06.2019 23:00
History, 21.06.2019 23:00

Advanced Placement (AP), 21.06.2019 23:00


