

Mathematics, 13.07.2021 06:20, joshuaburge13
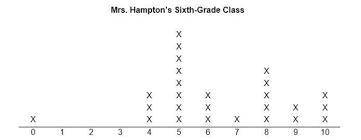
A survey was conducted to determine how many movies were seen in one month among the students
in Mrs. Hampton’s sixth-grade class. The results are shown in the dot plot below.
Step 1: Calculate the measures of center for Mrs. Hampton's data in the dot plot (round your
answer to the nearest tenths place). Show your work and briefly explain each step. (Measures of
Center are the Mean and Median of a data set)
Step 2: Calculate the measures of SPREAD for rs. Hampton's data in the dot plot. Show your work
and briefly explain each step. Measures of Spread are Range, IQR (Inter-Quartile Range) and
Mean Absolute Deviation.
Step 3: Collect and Record Your own data! Ask exactly 25 people the same question as above
(How many movies did you see in the last month). Record your data and Create a dot plot showing
your results.
Step 4: Calculate the measures of center for your data set (mean and median). Show your work!
Step 5: Calculate the measures of spread for your data set (Range, IQR and MAD). Show your
work!
Step 6: Create a BOX PLOT comparison for the two sets of data. Be sure to label each box plot
(Mrs. Hampton's Class, My Data)
Step 7: Summary-Compare the two data sets. Discuss similarities and differences in the two sets
of data (think about striking deviations, gaps, peaks, clusters, etc.). In your summary, answer the
following questions.
-What conclusion can you draw from looking at each data set?
-What does the measures of center and measures of spread tell you about each data set?
-Is either data set skewed? How do you know?
-Is it possible to use either or both of these data sets to draw VALID conclusions about the
number of movies a person sees in one month? Why or why not?
-Can you draw the same conclusion from the two different sets of data? Why or why not?
-Which set of data is more "spread" out based on your visual and your calculations.
-Which is a better measure of spread, the Range or the IQR and Why?

Answers: 3


Other questions on the subject: Mathematics
Mathematics, 21.06.2019 15:30, bajus4121
The table below represents a linear function f(x) and the equation represents a function g(x): x f(x) −1 −5 0 −1 1 3 g(x) g(x) = 2x − 7 part a: write a sentence to compare the slope of the two functions and show the steps you used to determine the slope of f(x) and g(x). (6 points) part b: which function has a greater y-intercept? justify your answer. (4 points)
Answers: 3
Mathematics, 21.06.2019 17:30, gungamer720
Nine more than four times a number is the same as one less than twice the number. find the number?
Answers: 1
Mathematics, 21.06.2019 18:00, 22justinmcminn
Darian wants to build a regulation size pool table that is 9 feet in length. he plans he ordered are 18 by 36 inches. what is the scale factor of the dilation he must use to build a regulation pool table
Answers: 1
Mathematics, 22.06.2019 00:30, def88
Efficient homemakers ltd. makes canvas wallets and leather wallets as part of a money-making project. for the canvas wallets, they need two yards of canvas and two yards of leather. for the leather wallets, they need four yards of leather and three yards of canvas. their production unit has purchased 44 yards of leather and 40 yards of canvas. let x be the number of leather wallets and y be the number of canvas wallets. draw the graph showing the feasible region to represent the number of the leather and canvas wallets that can be produced.
Answers: 1
Do you know the correct answer?
A survey was conducted to determine how many movies were seen in one month among the students
in Mr...
Questions in other subjects:
Mathematics, 03.06.2020 13:13
Mathematics, 03.06.2020 13:13
Mathematics, 03.06.2020 13:13
Mathematics, 03.06.2020 13:13


Health, 03.06.2020 13:13


