


Distributions and Comparing Data Project
Round all answers to the nearest tenth. Present your...

Mathematics, 09.07.2021 14:00, ellemarshall13
Distributions and Comparing Data Project
Round all answers to the nearest tenth. Present your work in a neat, legible way. Show all work.
Given the data set (16 values):
8, 6, 10, 5, 7, 1, 6, 11, 5, 13, 14, 8, 11, 9, 8, 6
1. Create a histogram and a box plot to represent this data set. What is the shape of the data
representation? Explain your reasoning.
2. Which measure of center and spread would you use to represent this data? Explain your reasoning.
3. Use a random number generator to generate a set of 15 numbers between 1 and 20. Create a
histogram and box plot to represent your data set. Calculate measures of center and spread. Which
measure of center and spread would you use to represent your data?
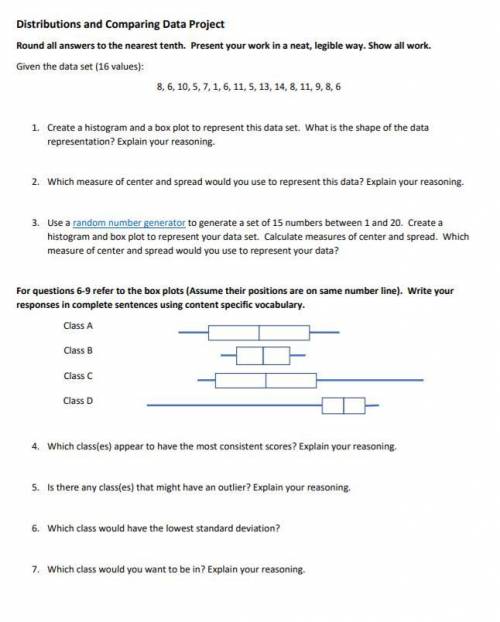
For questions 6-9 refer to the box plots (Assume their positions are on same number line). Write your
responses in complete sentences using content specific vocabulary.
Class A
Class B
Class C
Class D
4. Which class(es) appear to have the most consistent scores? Explain your reasoning.
5. Is there any class(es) that might have an outlier? Explain your reasoning.
6. Which class would have the lowest standard deviation?
7. Which class would you want to be in? Explain your reasoning.
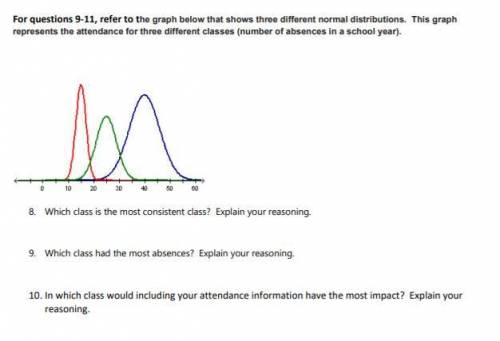
For questions 9-11, refer to the graph below that shows three different normal distributions. This graph
represents the attendance for three different classes (number of absences in a school year).
8. Which class is the most consistent class? Explain your reasoning.
9. Which class had the most absences? Explain your reasoning.
10. In which class would including your attendance information have the most impact? Explain your
reasoning.

Answers: 2
Other questions on the subject: Mathematics
Mathematics, 21.06.2019 13:30, iicekingmann
What value of x is in the solution set of –5x – 15 > 10 + 20x?
Answers: 1
Mathematics, 21.06.2019 21:30, Reebear1447
Abicycle training wheel has a radius of 3 inches. the bicycle wheel has a radius of 10 inches. approximately how much smaller, in square inches and rounded to the nearest hundredth, is the area of the training wheel than the area of the regular wheel? *
Answers: 3
Mathematics, 22.06.2019 01:00, nyraimccall408
Which is an accurate comparison of the two data sets? the commute to work is typically shorter and more consistent than the commute home. the commute to work is typically shorter but less consistent than the commute home. the commute to work is typically longer and less consistent than the commute home. the commute to work is typically longer but more consistent than the commute home.
Answers: 2
Do you know the correct answer?
Questions in other subjects:

Engineering, 23.04.2020 02:15

Geography, 23.04.2020 02:15
Mathematics, 23.04.2020 02:16
Mathematics, 23.04.2020 02:16

English, 23.04.2020 02:16


