
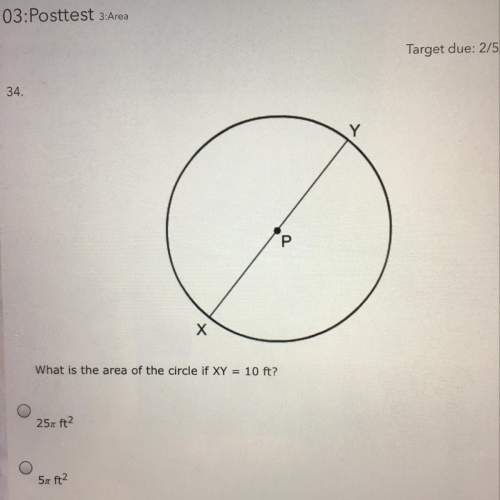


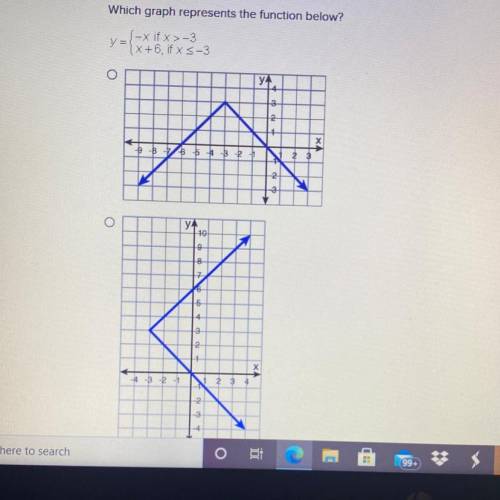
Which graph represents the function below?
y= { -x if x > -3
x+6, if x<(or equal to)3...

Mathematics, 09.07.2021 01:00, lilquongohard
Which graph represents the function below?
y= { -x if x > -3
x+6, if x<(or equal to)3

Answers: 2
Other questions on the subject: Mathematics
Mathematics, 21.06.2019 20:30, nsbegay2007
Tom is the deli manager at a grocery store. he needs to schedule employee to staff the deli department for no more that 260 person-hours per week. tom has one part-time employee who works 20 person-hours per week. each full-time employee works 40 person-hours per week. write and inequality to determine n, the number of full-time employees tom may schedule, so that his employees work on more than 260 person-hours per week. graph the solution set to this inequality.
Answers: 2
Mathematics, 21.06.2019 21:30, brittanysanders
Lizette is training for a marathon. at 7: 00 she left her house and ran until 8: 30, then she walked until 11: 30. she covered a total distance of 18 miles. her running speed was six miles per hour faster than her walking speed. find her running and walking speeds in miles per hour.
Answers: 2
Mathematics, 21.06.2019 22:50, alisonlebron15
What is the ordered pair of m’ after point m (5, 6) is rotated 90° counterclockwise?
Answers: 2
Mathematics, 21.06.2019 23:00, soldierboy771
What is the length of the midsegment of a trapezoid with bases of length 15 and 25 ?
Answers: 1
Do you know the correct answer?
Questions in other subjects:
Mathematics, 19.02.2021 21:50
Mathematics, 19.02.2021 21:50


Arts, 19.02.2021 21:50
Mathematics, 19.02.2021 21:50

Mathematics, 19.02.2021 21:50
Mathematics, 19.02.2021 21:50


