

Mathematics, 02.07.2021 22:10, laidbackkiddo412
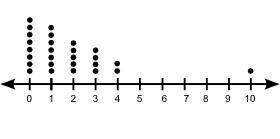
A dot plot with an axis marked from 0 to 10 at increments of 1 is shown. Plot shows 8 dots at 0, 7 dots at 1, 5 dots at 2, 4 dots at 3, 2 dots at 4, and 1 dot at 10.
A)
The mean is equal to the median and the data are symmetric.
B)
The peak is equal to the median and the data are skewed.
C)
The data are skewed and there is an outlier.
D)
The data are symmetric and there is an outlier.

Answers: 2


Other questions on the subject: Mathematics
Mathematics, 22.06.2019 03:20, 21stcenturycyber
The height of a box can be found by dividing its volume by the area of its base, bottom. what is the height of a box that has a volume of 26.35 cubic centimeter and a base area of 4 1/4 square centimeter?
Answers: 1
Mathematics, 22.06.2019 03:30, hannahkharel2
Which angle is the smallest? also give me an explanation so i can complete it to other questions as well, : )
Answers: 2
Do you know the correct answer?
A dot plot with an axis marked from 0 to 10 at increments of 1 is shown. Plot shows 8 dots at 0, 7 d...
Questions in other subjects:


Mathematics, 06.01.2021 19:00
Mathematics, 06.01.2021 19:00
Mathematics, 06.01.2021 19:00


