

Mathematics, 30.06.2021 21:00, rehel1546
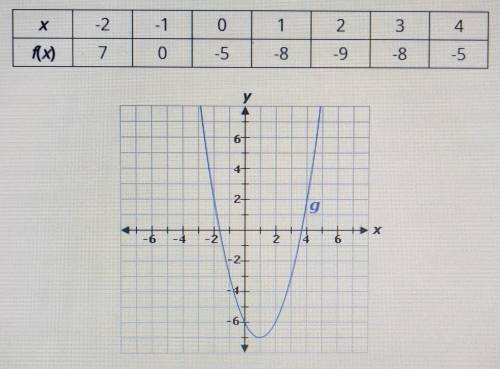
The table represents function f, and the graph represents function g.
x: -2, -1, 0, 1, 2, 3, 4
f(x): 7, 0, -5, -8, -9, -8, -5
The line of symmetry for function f is (y=9, x= -2, x=2, y= -9) and the line of symmetry for function g is (x=1,y=7,x= -1,y= -7). The y-intercept of function f is (equal to, less than, greater than) the y-intercept of function g. Over the interval [2, 4], the average rate of change of function f is (greater than, equal to, less than) the average rate of change of function g.

Answers: 2


Other questions on the subject: Mathematics
Mathematics, 21.06.2019 18:30, 25jzaldivar
Players on the school soccer team are selling candles to raise money for an upcoming trip. each player has 24 candles to sell. if a player sells 4 candles a profit of$30 is made. if he sells 12 candles a profit of $70 is made
Answers: 2
Mathematics, 21.06.2019 20:30, esnyderquintero
Find the area of the triangle formed by the origin and the points of intersection of parabolas y=−3x^2+20 and y=x^2−16.
Answers: 3
Mathematics, 21.06.2019 22:10, KekePonds1021
Which equation is y = -6x2 + 3x + 2 rewritten in vertex form?
Answers: 1
Do you know the correct answer?
The table represents function f, and the graph represents function g.
x: -2, -1, 0, 1, 2, 3, 4
Questions in other subjects:

Health, 11.07.2019 11:00

English, 11.07.2019 11:00
English, 11.07.2019 11:00
English, 11.07.2019 11:00
Mathematics, 11.07.2019 11:00

Social Studies, 11.07.2019 11:00

History, 11.07.2019 11:00
History, 11.07.2019 11:00
Social Studies, 11.07.2019 11:00


