

Mathematics, 26.06.2021 01:00, smithad1115
The following data represent the maximum wind speed (in knots) and atmospheric pressure (in millibars) for a random sample of hurricanes that originated in the Atlantic Ocean.
Atmospheric Pressure (mb) Wind Speed (knots) Atmospheric Pressure (mb) Wind Speed (knots)
993 50 1006 40
995 60 942 120
994 60 1002 40
Required:
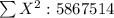
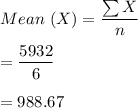
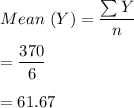
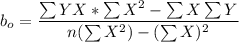
a. Find the y-intercept of the least-squares regression line, treating atmospheric pressure as the explanatory variable (round to four decimal places.)
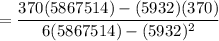
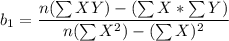
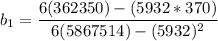
b. Find the slope of the least-squares regression line, treating atmospheric pressure as the explanatory variable (round to four decimal places.)
c. Is it reasonable to interpret the y-intercept of the least-squares regression line, treating atmospheric pressure as the explanatory variable? Why or why not?

Answers: 1


Other questions on the subject: Mathematics
Mathematics, 21.06.2019 18:30, veheca
According to the 2008 u. s. census, california had a population of approximately 4 × 10^7 people and florida had a population of approximately 2 × 10^7 people. which of the following is true? a. the population of florida was approximately two times the population of california. b. the population of florida was approximately twenty times the population of california. c. the population of california was approximately twenty times the population of florida. d. the population of california was approximately two times the population of florida.
Answers: 1
Do you know the correct answer?
The following data represent the maximum wind speed (in knots) and atmospheric pressure (in millibar...
Questions in other subjects:

Mathematics, 01.09.2021 21:00


French, 01.09.2021 21:00


