

Mathematics, 25.06.2021 17:50, mikeeway33
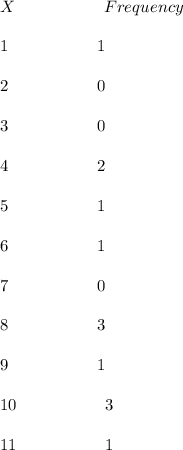
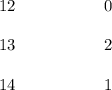
The following data represent the number of loaves of bread, in thousands, which were sold by various grocery stores in the month of June. Construct a dot plot for the given data.
4, 8, 11, 10, 10, 4, 5, 13,
6, 13, 8, 14, 8, 1, 10, 9
Select any value to see the controls for increasing or decreasing the frequency.
0 1 2 3 4 5 6 7 8 9 10 11 12 13 14 15 16

Answers: 2


Other questions on the subject: Mathematics
Mathematics, 21.06.2019 18:00, evarod
The given dot plot represents the average daily temperatures, in degrees fahrenheit, recorded in a town during the first 15 days of september. if the dot plot is converted to a box plot, the first quartile would be drawn at __ , and the third quartile would be drawn at link to the chart is here
Answers: 1
Mathematics, 21.06.2019 18:30, princessbri02
Which of the following is the result of expanding
Answers: 2
Do you know the correct answer?
The following data represent the number of loaves of bread, in thousands, which were sold by various...
Questions in other subjects:

Health, 16.10.2019 17:30

English, 16.10.2019 17:30


Mathematics, 16.10.2019 17:30
History, 16.10.2019 17:30
Mathematics, 16.10.2019 17:30


