


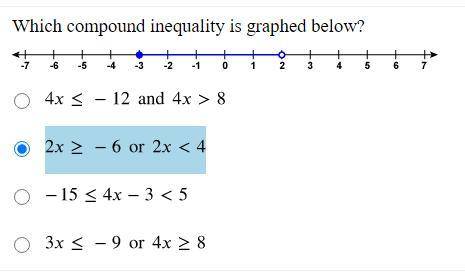
Which compound inequality is graphed below?
See attached picture.
...

Mathematics, 23.06.2021 05:20, alonzo8217
Which compound inequality is graphed below?
See attached picture.

Answers: 3
Other questions on the subject: Mathematics
Mathematics, 22.06.2019 02:50, villafana36
The graph of f(x) shown below has the same shape as the graph of g(x)=x^3-x^2 but it is shifted to the left 2 units what is its equation
Answers: 2
Mathematics, 22.06.2019 03:30, jonathanrgarcia
Mr. piper is driving peter, roddy, and scott home from school. all of them want to ride in the front seat. how can he make a fair decision about who rides in the front seat?
Answers: 1
Mathematics, 22.06.2019 07:20, luislopez05
The dot plot below shows the number of toys 21 shops sold in an hour: dot plot labeled number of toys sold shows 6 dots over 0, 4 dots over 1, 3 dots over 2, 3 dots over 3, 2 dot over 4 and 3 dots over 9 is the median or the mean a better center for this data and why? median; because the data is not symmetric and there are outliers median; because the data is symmetric and there are no outliers mean; because the data is symmetric and there are no outliers mean; because the data is skewed and there are outliers
Answers: 2
Mathematics, 22.06.2019 10:30, coalmax1212
Ineed with all 4 of these . and i do need to show work for all of them
Answers: 1
Do you know the correct answer?
Questions in other subjects:

Chemistry, 06.07.2019 02:30
Mathematics, 06.07.2019 02:30


Chemistry, 06.07.2019 02:30


English, 06.07.2019 02:30


